
The Use of Corrosion Rates to Predict Material Performance
As concrete structures begin to age and deteriorate, the need to understand corrosion behavior is pertinent to determining where a structure is in its life cycle. One of the most successful methods of determining the corrosion rate of embedded steels is the Linear Polarization Resistance (LPR) method. The results of this test method provide measurements of corrosion current (Icorr,) or corrosion penetration rates. From this measurement, metal loss predictions can be made. Based on scientific formulations (Faraday’s Law), the amount of iron or steel reverting to rust at the time of testing is projected. Based on known amounts of rust gain in the deterioration process, section loss can be converted to rust accumulation at the steel. As the accumulation of rust will eventually lead to distress of the concrete, this data is vital to predicting performance for reinforced concrete structures and for use in durability modelling.
Introduction
First introduced in 1957 by Milton Stern and A. L. Geary (Stern-Geary Equation), Linear Polarization Resistance (LPR) is an electrochemical technique used to measure the corrosion rate of a metal in an electrolyte. The object of a corrosion rate measurement in reinforced concrete is to determine the rate of embedded steel turning into rust. The corrosion rate measured in the field is a snapshot of the steel’s behavior at the time of measurement. The objective of the measurement is to be able to calculate, through Faraday’s Law of Metal Loss, what the average corrosion rate would be over a one year period based on the time the measurements were taken. These rates can then be utilized to determine long term performance of metals.
Prior to taking the corrosion rate measurement, the Corrosion Potential, or Ecorr, is measured and forms the baseline of the corrosion rate test. The potential is then changed anodically (more positive) or cathodically (more negative) by 20 milliVolt (mV), where the resulting corrosion current, or Icorr, is measured maintaining the 20mV potential change. This polarizes the steel to determine the resulting current. Essentially, a controlled voltage change determines the amount of current needed to balance the corrosion reactions.
The accumulation of scale is determined from measuring the amount of steel dissolving and forming oxide (rust). This is carried out by determining the electric current generated at the anodic reaction.
The anodic reaction is where iron looses two electrons:
Fe → Fe2+ +2e- Equation 1
These electrons are then consumed at the cathodic reaction: The cathodic reaction is where hydrogen combines with oxygen and the two electrons lost at the anode are gained at the cathode site, to form hydroxyl ions:
H2O + O2 + 2e- → 2OH- Equation 2
The resulting data from the field testing provides the investigator with the steel potential (mV) and consequently the corrosion rate in microns per year (μm/yr). This has a direct relationship to metal loss which is calculated by Faraday’s Law.
Faraday’s Law
The amount of material lost at the anode or deposited at the cathode is a function of the atomic weight of the metal or substance, the number of charges transferred, and the corrosion current (Icorr). This relationship was developed by Michael Faraday while working at the Royal Institute in London, England in 1833 (Figure 1).

Figure 1. Michael Faraday, English Chemist and Physicist, c 1850s. Courtesy of Pictorial Collection, Science & Society Picture Library.
Corrosion Rate Thresholds for Steel Reinforced Concrete Structures
The deterioration rate is very important, as it enables the engineer to decide when minor or more major work needs to be made to the structure.
In the use of coatings, the corrosion rate readings can identify when or how effective they are and can provide the engineer the option of applying further coatings when the corrosion rates start to increase to unacceptable levels.
The Icorr reading has been used to identify the amount of predicted section loss that would occur at the end of a year.
It should be noted that the best and most accurate means for the determination of corrosion related material degradation of steel in concrete is through the use of Linear Polarization Resistance. The results provide the amount of section lost on the steel by measuring corrosion current (Icorr). The results of the data can be utilized in durability models, where the relationship between metal loss, the amount of expansive oxide growth on the steel surface, and the subsequent tensile forces which will lead to cracking of the concrete can be established.
Identifying when these damages or failures will occur in reinforced concrete or steel frame structures can significantly reduce future damages by developing a proactive repair process. Durability models, such as Life 52™, allow for such predictions to be made. This type of service life program provides performance models that are predictive in nature, and is based on data collected from the structure including information on the concrete, steel and environmental conditions. An analysis can project when a structure will enter corrosion initiation, corrosion propagation, and time to cracking, and can be utilized to assess the longterm performance of the structure as well as repairs based on known historical performance.
The following tables show the relationship between corrosion activity and material degradation:
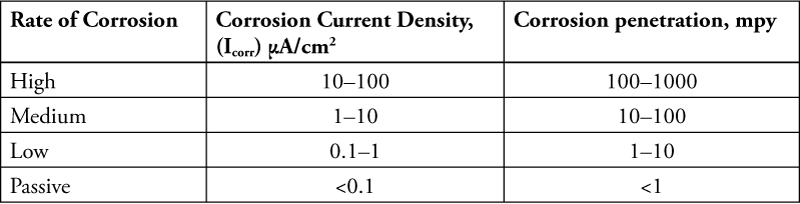
Table 1. Corrosion rates of steel in concrete.
Table 1 indicates the amount of corrosion penetration of the steel in mils per year (mpy) based on the measured corrosion current density, or Icorr. Icorr is the loss of electrons occurring at the anodic site of the corrosion cell and is measured in microAmps per square centimeter (μA/cm2).
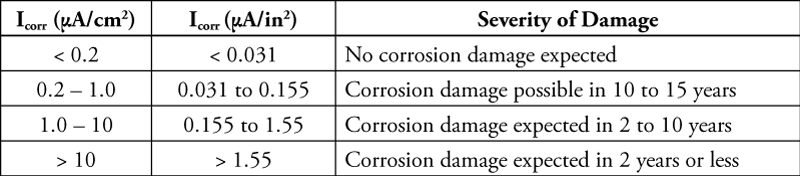
Table 2 . Corrosion rate and expected damage.
Table 2 provides corrosion current density values in both μA/cm2 and microamps per square inch (μA/in2) and the relationship to when anticipated damage would be expected to occur on a reinforced concrete structure.
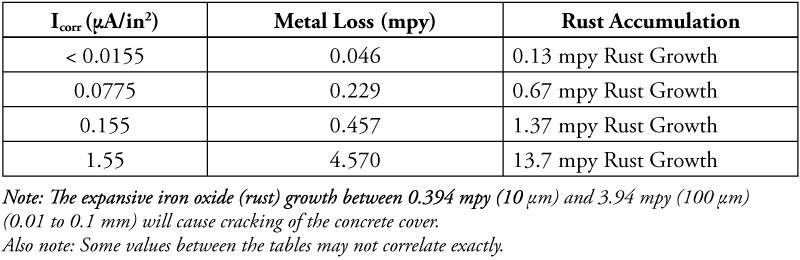
Table 3. Typical section loss and rust accumulation.
Table 3 indicates the relationship between corrosion current density, metal (section) loss of the steel, and the accumulation of corrosion scale, i.e. rust, on the reinforcing steel’s surface, measured in mils per year (mpy).
The Use of LPR in the Field
The LPR method allows the investigator to determine locations of corrosion hot spots versus corrosion potential, which is very important when assessing aged, chloride contaminated and carbonated structures. This is a key differentiator for condition assessments, as the half-cell potential is largely influenced by conditions which impact the steel’s electromotive force, EMF. The interpretation of half-cell potential data (in accordance with ASTM C876, Standard Test Method for Corrosion Potential of Uncoated Reinforcing Steel in Concrete), alone, can be very misleading when assessing aged concrete. Since the LPR method establishes the potential prior to obtaining the corrosion rate, the value of the data can allow a more accurate picture of corrosion behavior of the embedded steel.

Figure 2. Team getting ready to perform LPR test at location in New York City, May 2015.
The corrosion rate data can be used in a number of ways to assist the investigation and the design team (Figure 2). The data can visually illustrate corrosion activity by contouring the results alongside the corrosion potential. This provides a graphic depiction of where activity is occurring. This can allow the team to make more targeted openings and to further assess material properties that would impact corrosion. When the data is used in deterioration models, it can provide critical threshold limit states for section loss, rate of cracking, and service life performance and repair performance models.
A limitation of the testing method is that the results do not differentiate between chloride induced pitting corrosion or general corrosion. Pitting corrosion is a concentration cell and, therefore, the corrosion current is coming from one location versus general corrosion which can be assumed to occur across the entire surface area of the steel that is being tested. The standard surface area calculated in the LPR instrumentation is typically 100 cm2 (15.5 in2). When the steel surface area is greater than or less than this presumed area, adjustment factors in the corrosion rate need to be applied to the field data. Like chloride induced corrosion, if epoxy coated reinforcing (ECR) is tested for corrosion rate, the data collected can be less than 100 times the actual corrosion rates.
When assessing corrosion condition and material degradation where corrosion is present, LPR testing provides the foundation of the analysis. This data is extremely valuable in assessing remaining service life and predicting the durability of extant structures. Additionally, the understanding of general environments and macro and micro climates are required. The relative humidity (RH) and temperature of the concrete will influence the readings. Annual weather cycles, climatic conditions and atmospheric contaminants should be considered when carrying out the assessment. The authors have applied this test method and subsequent analyses in virtually all structure types ranging from historic landmark buildings, aging infrastructures, marine structures, industrial plants, and, more recently, relatively new construction.
The method can be applied to any embedded reinforcing steel where corrosion initiation has begun. Recent advances in technology are even allowing for polarization resistance to be measured in discontinuous steel elements, such as anchors and isolated ECR.
An interesting case study of the Irish Hunger Memorial, located in New York City, provides an illustration of the method employed in a corrosion assessment of a fairly new structure.

Figure 3. View of the east elevation.
2002 Concrete Structure with Epoxy Coated Reinforcing
A memorial, located on a 0.5-acre site in New York City, was completed in 2002 and assessed in 2015 (Figure 3). The Memorial was designed to resemble a hill in the Irish countryside, and thus the structure was built at an incline. The edges of the inclined structure resemble cantilevered soffits when viewed from below. An area on the south cantilevered soffit was exhibiting cracking, one spall, efflorescence, water infiltration, and corrosion of the construction support chairs, which were visible from below. There was concern that the conditions could be impacting the performance and longterm durability of the embedded reinforcing bars at this location. The scope of the project was to determine the corrosion condition of the embedded reinforcing steel where moisture staining and efflorescence was visible.
Construction
The structure is a gently sloping platform with support walls. The concrete platform has both precast concrete beams and reinforcing steel. The reinforcing steel is epoxy coated and the structural steel was presumed to be uncoated.
Summary of the Corrosion Evaluation
The condition of the south cantilever soffit exhibited visible signs of continuous water infiltration, possibly from a waterproofing membrane failure above the concrete soffit. A considerable amount of efflorescence was present as well as small stalactites with dripping water hanging from the same area, as shown in Figure 4. In addition, horizontal cracking was observed on the lateral surface of the cantilever soffit.
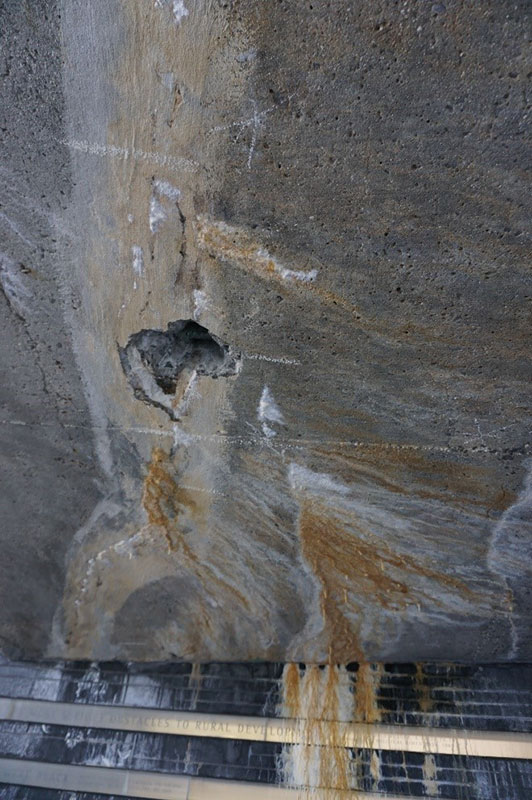
Figure 4. Efflorescence and water infiltration is visible on the south soffit of the cantilever.
Three different reinforcing bars were located to verify continuity of the steel within the structure and these bars were exposed using a hammer drill. After the reinforcing bars were exposed, it was observed that the bars were coated with green epoxy as indicated in the original drawings. The surfaces of the reinforcing bars were then ground to expose clean (near white) metal, is a requirement for continuity testing. The exposed reinforcing bars were then tested for electrical continuity. This is done by measuring the electrical resistance between each area of exposed reinforcing bar. Each reading showed a resistance below 1 ohm, suggesting that the reinforcing steel was continuous. The purpose of the continuity test was to ensure that the bars were continuous, especially for epoxy coated reinforcing bars which are often discontinuous. Discontinuous steel cannot be easily tested, as a connection would be required at each piece of steel.
Concrete cover, half-cell potential, corrosion rates and resistivity were carried out and analyzed to assess the impact of the epoxy coating on macro cell corrosion behavior. As half-cell and corrosion rates were detected, these indicated that “holidays” (which are holes in “coating language”) in the coatings were present. It is quite unusual to detect active corrosion rates in fairly new ECR unless degradation of the coating is present.
Due to the use of epoxy coated reinforcing, macro-cell corrosion will exist where there are holidays in the coatings. The data was analyzed with four variations of ‘exposed steel’ surface area. The instrumentation used for corrosion rate testing assesses the data as if the steel is uncoated and the readings account for a surface area of 100 cm2 (15.5 in2) of exposed steel. Since the steel is epoxy coated, the values measured would be an underestimation of the actual corrosion activity on the structure. Therefore, the data values were increased to represent 50%, 25% and 5% of the collected values. The calculations, which provided a decrease in surface area, were performed to illustrate the increases of corrosion activity which occur with ECR corrosion concentration cells. This is referred to as a macro-cell effect, found to be a common issue with epoxy coatings. This type of corrosion occurs in a similar manner to chloride induced pitting corrosion (Figure 5).
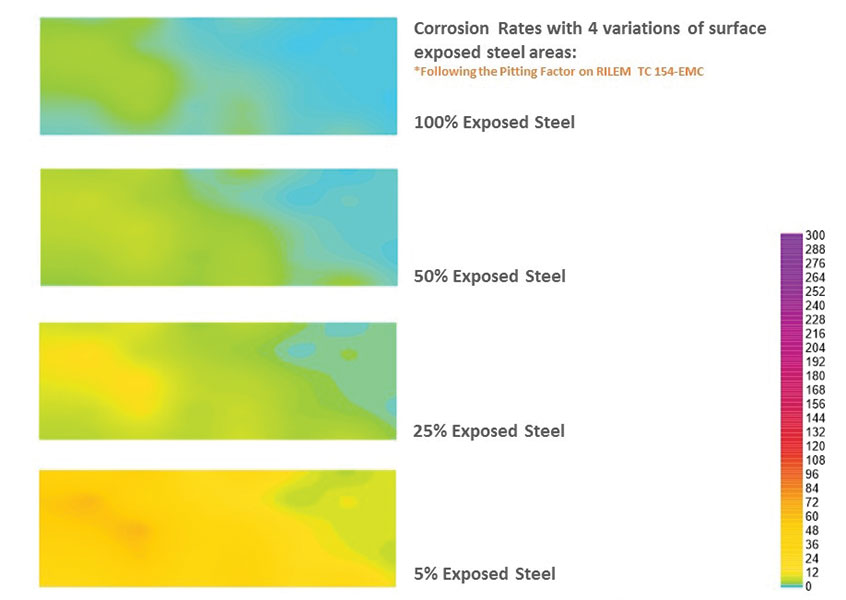
Figure 5. Corrosion rates with four variations of surface exposed steel area.
Results Analysis
Life 52 durability models were used on various readings to help the client understand the damages which would occur on their structure in the future. The cracking models that were used are applied to existing structures to determine two parameters: 1) when the structure may exhibit damages in relatively sound material based on current corrosion activity, and/or 2) when the structure may exhibit damages after a traditional repair is performed in which corrosion is not addressed as part of the repair.
This model is a function of steel size (geometry and surface), concrete cover, and the compressive strength of the concrete cover. This calculation determines the time frame from which tensile forces created by the formation of iron oxide or rust (based on actual corrosion current) will cause cracking and damages to the concrete cover. Variations occur in reactions based on all factors. For this model, a 0.5 mm (0.02 inches) crack was used in the calculation. This value, 0.5 mm (0.02 inches), is considered by the corrosion industry to be a crack width that is sufficient in size to support corrosion activity. Cracks which are greater than 0.5 mm (0.02 inches) will allow oxygen, moisture and atmospheric solids into the concrete electrolyte.
At present, the models for the Memorial indicate that, based on the intensity of the corrosion activity, there may be corrosion related damages occurring from the present time through the next 40 years in the best case scenario. As macro-cell corrosion is more intense than general corrosion, it would be presumed that corrosion related deterioration could occur between 4 and 10 years.
Conclusions
From the results of the field testing, it can be illustrated that the use of Linear Polarization Resistance as a supplementary test method to a condition survey can assist the team in determining actual corrosion activity. The case study presented a unique structure type where LPR testing was utilized for a more novel purpose than it would have been typically employed.
For the Memorial project, the corrosion rate data provided significant insight into the active rates of corrosion for new structures. From the testing, the team was able to provide the owner with a forecast of the structure’s future condition, and a methodology for utilizing future testing methods after the structure is repaired.
In all instances where the authors have performed LPR testing, the results, utilized with durability and service life models, have allowed the team to assist the client in understanding the urgency and necessity of repairs required to their structures. Additionally, with advances in corrosion testing instrumentation, this method can be applied to reinforced concrete structures, epoxy coated reinforcing steel, steel frame structures and buildings, and even discontinuous elements such as masonry anchors and steel plates.▪