
Bridge deflection and vibration data are often useful for structural health monitoring (SHM), load rating determination, change in use, or retrofitting. Deflection and vibration data are typically gathered through nondestructive testing (NDT) or nondestructive evaluation (NDE) methods. For most bridges, this means installing accelerometers, strain-gauges, linear variable differential transformer (LVDT), or string pot type instrumentation, which sometimes requires a temporary restriction of bridge use, and technicians must gain access to the bridge’s structural members which can involve fairly hazardous work, both to install the instruments and to remove them when the study is complete. Once the bridge is instrumented, the data is traditionally transmitted via cell-phone signal and then processed. While these traditional methods do generally produce reliable data, they can be time consuming and costly.
In the past few years, a new NDE instrument has arrived in North America that presents structural engineers with an attractive option for acquiring bridge deflection and vibration data. The instrument is known as IBIS, which is an acronym for Image By Interferometric Survey. And while this instrument may look like a whimsical character in a Pixar film (Figure 1), rest assured that it’s all business!
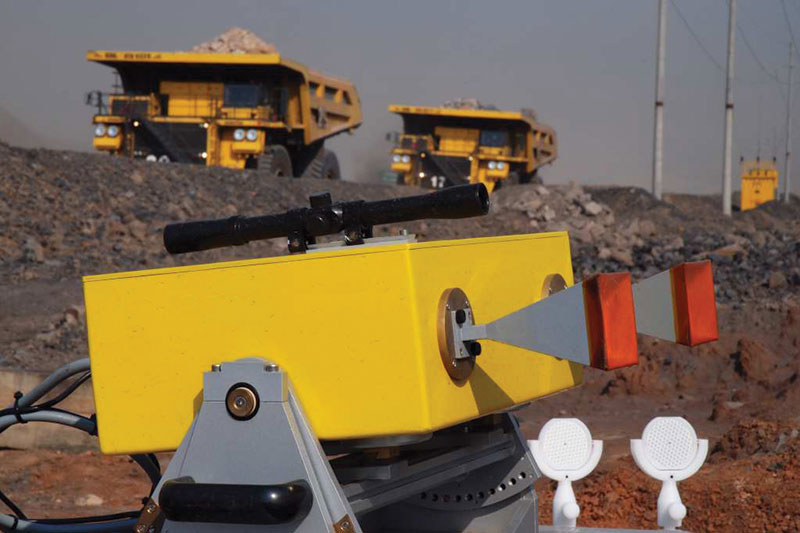
Figure 1: IBIS Instrument.
IBIS relies on advances in radar technology – interferometric radar, to be specific – to measure deflection of structural members as a function of time. When a strong radar reflection is obtained, the instrument can measure deflection to an accuracy of 1/250th of an inch for all structural elements in the line of sight. Data can be acquired at a rate of 200 Hertz, which allows the user to measure structural vibrations up to 100 Hertz. This provides plenty of range for most structural engineering purposes, because the most meaningful vibration data from civil infrastructure is typically below 100 Hertz. The instrument can be used at distances as much as 3,200 feet away from the structure, although closer ranges are typically used for bridges. The non-contact nature of IBIS, along with its quick set-up, is one of the main differentiating features when compared to typical current instrumentation.
How it Works
Radar relies on the Doppler Effect, wherein the reflected radar waveform reveals the location of an object. Radar has long been used to track the movement of objects, but the range of discernible movement typically was measured in feet. In the case of bridges and other structures, however, we are interested in measuring much smaller amounts of deflection. By noting the phase change in the reflected wave form (as is the case with interferometric radar), IBIS achieves a high degree of accuracy when measuring deflection and vibration.
As one might suspect, the instrument works well only when the object to be measured is a good radar reflector. Thus, bridges shaped like the stealth bomber are a bad match for IBIS. For the remaining bridges out there, steel proves to be a good reflector, whereas concrete and timber do not reflect radar well. For concrete or timber bridges, an ideal radar reflector can be installed (Figure 2) on the structural member in question. These reflectors work well, but the process of installing them presents some of the same hazards associated with the aforementioned traditional instrumentation, although the process is simpler than installing instruments because the reflectors do not require hard wiring.
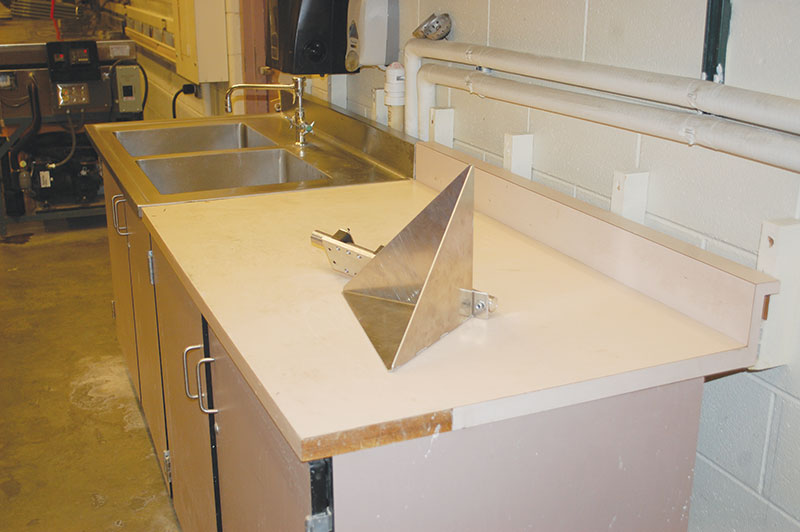
Figure 2: Ideal radar reflector.
Because IBIS relies on radar, data can be obtained from a remote point, as long as a clear line of sight is available. For most highway overpasses, establishing a clear line of sight is not a problem. For bridges over waterways, however, finding a clear line of sight may be a challenge if substantial vegetation is present, although this difficulty can usually be overcome.
Once a location with a clear line of sight is found, the IBIS instrument can be set up in about 15 minutes, and data collection can begin immediately. The instrument is connected to a conventional laptop and operated with Matlab-based software provided by the manufacturer. The user views an X-Y radar plot that shows radar reflection on the Y-axis and distance from the instrument on the X-axis. The peaks correspond to objects that are reflecting radar well, shown as a high signal-to-noise ratio (SNR) (Figure 3). Using a laser distometer, the user can determine which structural members correspond to which peaks on the radar plot. At this point, data are being collected under live loads from a remote point, for all objects that are reflecting radar well. For a bridge with steel cross frames connected to girders, the user can typically gather data on all the cross frames at one time, provided they are all visible. The instrument accounts for the unique angle to each object it is measuring.
Figure 3: Radar reflection plot. Peaks correspond to members that are reflecting radar well. On the X‑axis, each rangebin equates to 2.46 feet distance from the instrument.
Because IBIS is radar based, the movement in structural members is along the line of sight of the radar. At first thought this might seem like unusable data, but because such a small amount of movement can be measured, the minor amount of movement along the line of sight can be used (via trigonometry) to calculate vertical displacement. Once the user inputs the angle of the radar head, IBIS then automatically does the math to export vertical displacement data. Figure 4 shows an exaggerated view of this concept.
Figure 4: By measuring the original distance to the structural member (X1) and the distance to the member after a load is applied (X2) and knowing the angles, IBIS calculates actual vertical displacement (Y).
When data collection is complete, the data can be viewed immediately in a Matlab-based post-processing software package, which allows the engineer to validate the data set and view deflection data in both the time and frequency domains. Because data are often obtained for several cross sections along the length of the bridge, one-dimensional vibration (vertical direction) data can be viewed quickly – the data can be plotted as a line plot along the length of the bridge and that data can be animated as a function of time, with a click of a button.
Experiment
Most engineers will recognize the value of an instrument that can be set up in minutes and will collect deflection/vibration data on all structural elements in the line of sight without requiring direct access to the bridge. However, when it comes to IBIS’s claims of accuracy and ease of use, this engineer was as skeptical as any who might think it sounds too good to be true. Therefore, a field experiment was undertaken to measure vibrations on a cable-stayed pedestrian bridge (Figure 5) and verify the data collected using traditional accelerometer methods.
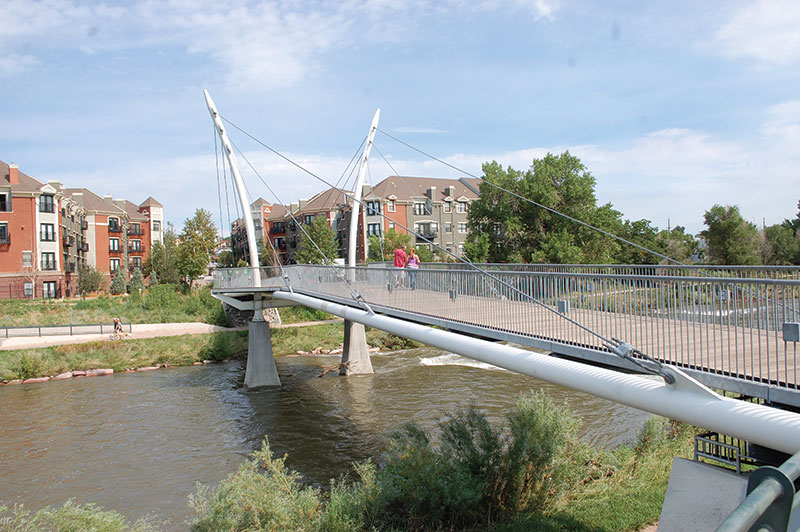
Figure 5: Cable-stayed bridge.
The subject bridge is a 243-foot long pedestrian bridge owned by the City and County of Denver. The bridge provides pedestrian access over the Platte River, from Sixteenth Street in downtown Denver to a nearby area known as the Highlands. The bridge was built in 2003 and features two steel masts, nine structural steel strands, 16-inch diameter steel tubes as the main girders, steel floor beams, and timber stringers and deck.
Global vibration data were desired for the bridge as a whole, along with local vibration data on the steel strands and towers. These data were obtained by setting up the IBIS instrument adjacent to one abutment and viewing the length of the bridge (Figure 6).
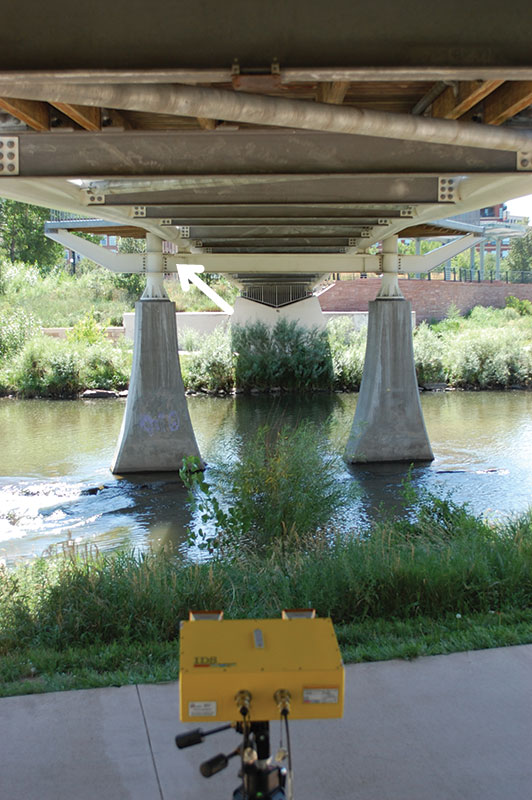
Figure 6: IBIS set-up beneath cable-stayed bridge.
Due to a cross member (shown by the arrow in Figure 6), not all floor beams were in the line of sight. However, data on nine floor beams were obtained simultaneously from one set-up. Data were acquired on multiple occasions during different seasons, and the data consistently indicated that the global natural frequency of the bridge, in the vertical direction, was 1.98 Hertz. Figure 7 is an IBIS-generated plot that shows vibration data for nine floor beams. Global natural frequencies at 1.98 Hertz, and local natural frequencies at 2.66 Hertz on the floor beams, are noted in Figure 7. The data shown in Figure 7 were obtained in less than two hours, including set-up time and multiple iterations.
Figure 7: Vibration data from nine floor beams on cable-stayed bridge.
Next, vibration data were obtained by setting up IBIS at nearly the same elevation as the bridge deck while collecting data on the structural steel strands, steel masts, and steel guard rails. Data for the structural steel strands were acquired through four different set-ups. Vibration and deflection data were obtained on all of the subject elements, and the data consistently showed a global natural frequency of 1.98 Hertz and local vibration modes of interest. Independent data collection with an accelerometer verified the IBIS data. Additional laboratory work with accelerometer data consistently verified the IBIS data. We are also aware of similar work by other researchers that has validated IBIS data using other methods.
Limitations
The most obvious limitation to the IBIS system is that it requires a clear line of sight to the structure; therefore, vegetation and other obstructions can make it difficult to use. Also, IBIS can’t distinguish between different structural elements that are closer than 2.46 feet apart from each other, and this is not adjustable. While this typically doesn’t translate to a real-world problem in bridge structures, it is worth noting.
IBIS also has a limitation in that the object you are viewing must be larger than 0.70 inches. Again, this is rarely a limitation, but in the case of small diameter steel rods or cables, it could be a factor to consider. A work-around would involve installing an ideal radar reflector on the object, as described above.
Finally, the typical IBIS set-up measures displacement in only one dimension (one degree of freedom). In many applications, mode shapes of two (or more) degrees of freedom are of interest. This is especially true for suspension bridges and other structures with dominating torsional mode shapes. While two-dimensional mode shapes are not quickly accomplished with IBIS, other researchers have used alternative IBIS set-up configurations to obtain two-dimensional mode shapes, proving it is possible.
Conclusions
Due to advances in technology, radar is now a useful NDT/NDE tool for evaluating bridges and other structures. The IBIS radar technology has limitations, such as the need for a clear line of sight and restrictions on size and composition of members that can be measured, but in situations that aren’t subject to those limitations, the instrument has proven to be an accurate and efficient method for measuring deflection and vibration in bridges. Data are obtained in a non-contact manner, without interrupting the use of the structure, and data acquisition and compilation are completed much more rapidly than is possible using traditional strain-gauge and accelerometer methods.▪
Acknowledgements
The author thanks Larry Olson and Olson Instruments, Inc., of Wheat Ridge, Colorado, for providing the IBIS instrument for use in this research. Olson Instruments is a vendor for the IBIS instrument in North America, providing instruments and operators, as well as user training. This work was completed as part of a master’s thesis at the University of Colorado at Denver and, as such, the author is grateful to the following for their guidance and assistance: Dr. Fredrick Rutz, Dr. Rui Lui, and Dr. Kevin Rens, all of the University of Colorado at Denver.