
What Has Changed and Why?
The new ASCE 7-22, Minimum Design Loads for Buildings and Other Structures, ground snow load maps target uniform reliability rather than a uniform hazard (Bean et al., 2021). Previously, the ASCE 7 snow loads used a uniform-hazard 50-year mean recurrence interval (MRI) with a 1.6 load factor. These loads resulted in non-uniform reliability for structures across the country. The site-specific ground snow load determination is no longer tied to a uniform hazard (i.e., X-year recurrence interval) but to the safety or reliability levels stipulated in Chapter 1 of ASCE 7. The new strength level loads are used with a load factor of 1.0, as shown in Equation 1, and were selected to create uniform reliability across the country. These loads are mapped in the new ASCE 7-22 Chapter 7 in the online Hazard Tool and additionally reduced the number of case study regions by 90%.
φRn = 1.2Dn + 1.0Sn (Eqn. 1)
In Equation 1, φ is the resistance factor; Rn is the nominal resistance; Dn is the nominal dead load; and Sn is the nominal roof snow load. Snow loading has significant site-to-site variability, both in mean, coefficient of variation, and shape of the statistical distribution of measurements.
The earlier 1.6 safety factor, introduced by Ellingwood et al. (1980), bridged the gap between the largest expected snow load during the service life of the structure (i.e., 50-years) and loads that achieve safety objectives. The factor was derived by considering the average behavior of ground snow load probability distributions at eight locations across the country. This is a rational and computationally feasible approach for estimating design snow loads but averaging necessarily overestimates design snow loads in some regions and underestimates them in others. Fortunately, modern computational power and contemporary weather station data can estimate site-specific, reliability-targeted design snow loads.
Reliability Targeted Loads
ASCE 7-22 Chapter 1 expresses safety as a reliability index of 3.0 for ductile limit states in Risk Category II structures, corresponding to an annual probability of failure of 3 × 10⁻⁵, which results in an approximate mean failure interval of 30,000 years. Such a low probability of failure is difficult to contextualize for any single building and outside the range of personal experiences. A different perspective on the 30,000-year interval is that, out of perhaps 10,000 communities in the U.S., one would not want to see failures due to snow overload in more than about one of those 10,000 communities every three years.
This low failure rate requires the extrapolation of the statistical distributions describing all ASCE 7 considered hazards (snow, wind, etc.) to events that exceed those observed in the period of record (which is well under 150 years and, in many cases, under 50 years). The resistance factor and the inherent conservatism in design procedures deliver part of the safety. Still, most of the margin must be based on the source with the highest statistical variability, which in this case is the snow load.
Bean et al. (2021) conducted a site-specific reliability analysis to determine ground snow loads, considering both the uncertainty in the snow load and the structural resistance. The targeted resistance member was the flexural yielding (0.9ZxFy) of a steel W-shape using new A992 steel statistical models (Bartlett et al., 2003). This resistance was combined with a flat roof condition and a nominal dead load of 15 psf to be consistent with common roof construction. The authors also developed a unified depth-to-weight conversion (effective density) that converts ground snow depth to load, based on winter temperature, winter precipitation, and distance to coastlines, allowing data from stations that measure depth, but not ground snow load, to be incorporated into the analysis. Site-specific snow load measurements were fit with a three-parameter Generalized Extreme Value distribution. This distribution can model symmetric (e.g., normal) or right-skewed (e.g., lognormal, extreme) data, capturing the climatic variability in snow load patterns across the country. Uncertainties were propagated through the assessment using Monte Carlo simulation, the outcome of which is a load at each site that achieves the targeted low probability of failure. The reliability-targeted loads were assessed at nearly 8,000 snow measurement locations in the U.S.; loads at other locations were determined from a mapping algorithm developed by the authors of Bean et al. (2021).
Calculations were performed for each risk category and associated target reliability index, β, thus eliminating the need for separate snow importance factors. Careful examination of the values from the four maps for each Risk Category shows that the ratio of load between risk categories is not constant; the ratio depends upon the site-specific climate, as represented in historical data for snow accumulation. This fact illustrates why using a single load factor of 1.6 applied to 50-year MRI loads results in inconsistent levels of safety.
More than 40 years of additional snow load data, covering a larger area of the country, made it possible to perform site-specific reliability analyses and significantly reduce Case Study regions in the west. The Case Study regions have been reduced by more than 90% from what they were in ASCE 7-10 and 7-16, prior to the adoption of state-specific studies into the standard.
Changing Loads
Figure 1 presents local snow load histograms, and the resulting distribution fits for Minneapolis, Boston, and Baltimore. Figure 1 multiplies the ASCE 7-16 ground snow loads (black dashed lines) by 1.6 to make them directly comparable to the ASCE 7-22 Risk Category II ground snow load loads (red dotted lines). Notice that Boston, Minneapolis, and Baltimore all have very similar maximum measured loads, even though Minneapolis typically receives more snow than Baltimore or Boston. Generally, cities like Minneapolis in the upper Midwest or others in Northern New England that regularly receive moderately high snow loads may see loads decrease in ASCE 7-22. This is because there is a smaller relative difference between the typical annual maximum load and the extreme annual maximum load.
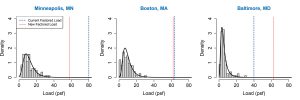
In contrast, mid-latitude locations (Baltimore, Chicago, Denver, Portland, etc.) needed a larger design load (relative to the 50-year MRI) than other parts of the country to achieve reliability targets. These places all tend to see intermittent snowmelt throughout the snow season but also have recorded annual peak loads from substantial accumulations of snow in very short periods. In short, these locations typically did not receive large snow accumulations, but they all have the potential for extreme snow accumulations under the right extreme conditions.
The potential for extreme deviation from typical behavior drives the reliability-targeted loads. For example, Minneapolis receives substantially less winter (Dec – Feb) precipitation than Baltimore on average (2.9 vs. 9.6 inches, from PRISM 2015), but Minneapolis almost always receives that precipitation as snow because of consistently colder temperatures. The reliability-targeted loads reflect what might happen if the mid-Atlantic received a series of super-heavy storms with unusually cold temperatures that prevent the snow from melting between storms. The chance that such an event happens in the lifetime of a building is small, but so is the probability of failure that ASCE 7 permits.
Many local jurisdictions such as Portland (SEAO 2013), Denver, and Baltimore (Baltimore County Building Code, 2015) had already superseded ASCE 7-16 loads with requirements that are like those in the new maps. DeBock et al. (2016) demonstrated the non-uniform reliability of the ASCE 7 snow loads in Colorado and introduced the concept of reliability targeted snow loads. Engineers and building officials in Colorado had long recognized the potential for extreme loads exceeding the published ASCE 7 values in Denver and the eastern plains of that state.
Cost Impact
While a few locations had snow loads that changed drastically, most locations have an ASCE 7-22 factored flat roof load of 0.95 to 1.15 times the ASCE 7-16 factored flat roof load with an average ratio of 1.05.
One of the more significant changes in design Ground Snow Load values occurred in Baltimore, Maryland. In ASCE 7-16, pg is 25 psf (× 1.6 load factor). The reliability targeted (ASCE 7-22) value of pg for Risk Category II is 60 psf (× 1.0 load factor) for this location. The change calculated to the roof Total Load (using a uniform roof dead load of 15 psf) is an increase of 30%. Two buildings were analyzed for these loads (along with changes to the minimum roof snow load) to assess the cost on a snow-sensitive metal building, as shown in the Table. There is a about 1% total cost increase with the new loads vs. ASCE 7-16. However, Baltimore County had already superseded requirements presented in ASCE 7-16 by requiring a minimum roof snow load of 30 psf (or 48 psf factored roof load), exceeding the design roof snow load resulting from the reliability targeted load.

Mean Recurrence Interval
Past ASCE 7 uniform hazard snow loads defined a single recurrence interval for each load. However, the mean recurrence interval for the calculated design snow load in the reliability-targeted scenario is no longer constant because the shape of the snow load distribution changes to reflect site-specific climatic conditions. Figure 2 illustrates this variation with vertical dashed lines showing the load that results in a reliability of 3.0 in each scenario. For this illustration only, the reliability analysis assumes the snow load and resistance follow normal probability distributions and ignores all other sources of variability (such as dead load).
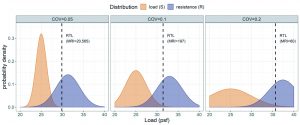
In this simplified scenario, the reliability-targeted load increases as the coefficient of variation (COV) of the ground snow load distribution increases. This increase is associated with a reduction in the MRI, as indicated by the increasing area to the right of the black dashed line in the upper tail of the ground snow load (orange) distribution. When the COV of the ground snow load distribution gets larger, the variability of the resistance loses importance, and the MRI gets smaller. In short, if the annual variability of the hazard (i.e., snow load) changes relative to the variability of the resistance, the MRI of the design snow load must also change to maintain a constant probability of failure.
Final Thoughts
The changes coming to the ASCE 7-22 ground snow loads dramatically reduce the number of case study regions, incorporate 40 years of additional data, and create a more uniform risk of failure across the U.S. Shifting away from uniform hazard to uniform risk-based snow loads should provide engineers and owners reassurance that their structures are designed for the anticipated level of safety and will reduce the need for local jurisdictions to supersede ASCE 7. While changes in some locations may appear significant, the anticipated average total cost impact is minimal.■
References
Baltimore County Building Code, Baltimore County Council Bill 40-15, Effective July 1, 2015, Page 46, www.baltimorecountymd.gov
Bartlett, F. M., Dexter, R. J., Graeser, M. D., Jelinek, J. J., Schmidt, B. J., and Galambos, T. V. (2003). “Updating standard shape material properties database for design and reliability.” Engineering Journal, American Institute of Steel Construction Inc, 40(1):2–1
Bean, B., Maguire, M., Sun, Y, Wagstaff, J., Al-Rubaye, S., Wheeler, J., Jarman, S., and Rogers, M. (2021). “The 2020 National Snow Load Study.” Mathematics and Statistics Faculty Publications. Paper 276.
DeBock, D. J., Harris, J. R., Liel, A. B., Patillo, R. M., and Torrents, J. M. (2016). Colorado design snow loads. Technical report, Structural Engineers Association of Colorado, Aurora, CO
Ellingwood, B., Galambos, T. V., MacGregor, J. G., and Cornell, C. A. (1980). Development of a probability-based load criterion for American National Standard A58: Building code requirements for minimum design loads in buildings and other structures. Volume 13. U.S. Department of Commerce, National Bureau of Standards.
PRISM Climate Group (2015). Oregon State University, http://prism.oregonstate.edu
SEAO (2013). Snow Load Analysis for Oregon – Fourth Edition. Structural Engineers Association of Oregon and Prism Climate Group, Oregon State University. Portland, OR.