
Part 1
This is Part 1 of a two-part series. This installment summarizes two methods of determining available strengths from testing of aluminum structures, presents equations, and includes selected plots of calculated safety factors. The next part will discuss and compare the results from the two methods.
Let’s say you have some test data for an aluminum component or structure. Will it make a difference which method is used to establish an available strength with that data? In the Aluminum Association’s 2020 Aluminum Design Manual, Part 1 – Specification for Aluminum Structures (Appendix 1: Testing [§1.3]), there are two methods for determining available strength from test data. This study included both the Allowable Strength Design (ASD) and Load and Resistance Factor Design (LRFD) procedures to compare the results from these two methods. This was an analytical study only – no tests were conducted. However, the author’s prior use of these two methods, for a few individual sets of test data, indicated that allowable strengths from Method 1 tended to be more conservative than those from Method 2.
The number of samples considered ranged from 7 to 50 and the coefficient of variation from 4% to 20%. For Method 1, safety and resistance factors from the Specification are applied to calculated nominal strength values based on test statistics. Method 2 available strengths are found by applying calculated (using test statistics and other parameters) safety and resistance factors to test averages. Of the many possible input values for Method 2, the current study was restricted to default values for the parameters. Plots of Method 2’s calculated safety factors provide a sense of the wide range of possible values. For the set of variables considered, this study (including Part 2) shows that available strengths based on Method 1 are generally, but not in all cases, less (by widely varying percentages) than corresponding values from Method 2.
Method 1
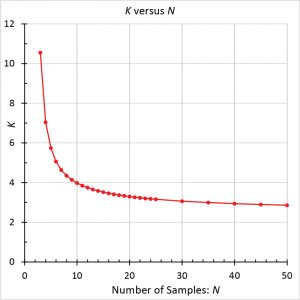
This method is simpler to use than Method 2 and has fewer input parameters. As given in the Specification for various limit states, the pertinent safety factors (Ω) for ASD range from 1.95 to 3.0, and the resistance factors (φ) for LRFD from 0.75 to 0.50. To find the allowable strength (R1Ω), this method uses a calculated nominal strength (RN1), which per Method 1 is based on test statistics, divided by a safety factor chosen separately depending on the limit state. Similarly, the design strength (R1Φ) is the product of the resistance factor and RN1. The nominal strength (RN1) is a statistical lower bound (99% exceedance, with 95% confidence) on strength, which is based on test average (RTM), sample standard deviation (σx), and a statistical coefficient (K; Figure 1) that is based on the number of samples (N). Minimum N is 3. For 7 ≤ N ≤ 50, K varies from 4.641 to 2.863. K accounts for uncertainty about the possible difference between the sample and population standard deviations; it increases at an increasing rate as N becomes smaller, especially for N less than about 20.
To compare Method 1 available strengths with Method 2 available strengths, for ASD and LRFD, the applicable equation for the non-dimensional ratio of available strength to average test strength was determined for each method. Variables include:
K = statistical coefficient
N = number of samples
RN1 = calculated nominal strength
RTM = test mean (average) strength
σx = sample standard deviation
φ = resistance factor for LRFD
Ω = safety factor for ASD
The Method 1 allowable strength (ASD) is: R1Ω = RN1 / Ω = (RTM – Kσx) / Ω (Eqn. 1)
Now divide the allowable strength by the test average. Note that the coefficient of variation CV = σx / RTM: R1Ω / RTM = (1 – KCV) / Ω (Eqn. 2)
The Method 1 design strength (LRFD) is: R1Φ = φRN1 = φ (RTM – Kσx) (Eqn. 3)
Divide the design strength by the test average: R1Φ / RTM = φ (1 – KCV) (Eqn. 4)
Method 2
See the Specification for further Method 2 details. As an example, this method had previously been applied to data for screw pull-out from screw chases. For the current more general study, the default values of various parameters were employed:
- α (= 0.2): dead-to-live load ratio
- Mm (= 1.00 for rupture): material factor
- Fm (= 1.00): fabrication factor
- VM (= 0.06): material variation
- VF (= 0.05 for structural members and mechanically fastened connections; 0.15 for welded connections): fabrication variation
- VQ (= 0.21): load variation
- βo (= 2.5 for beams and columns, 3.0 for tension members and 3.5 for connections): target reliability index.
To determine allowable strengths (R2SF) for Method 2, the average test strength is divided by a calculated safety factor (but not less than a minimum), which depends on many statistical variables. To distinguish the safety factor (Ω) in Method 1 from that in Method 2, the notation SF2 is used here for the Method 2 safety factor.
SF2 = eψ (1.05α + 1) / [MmFm (α + 1)] (Eqn. 5)
where,
ψ = βo (VM2 + VF2 + CNVP2 + VQ2)0.5
Here, VP = CV, which is the coefficient of variation for the test results, and CN = (N2–1) / (N2–3N). The minimum N is 4. For ASD, SF2* is the greater of SF2 and the applicable value of Ω in the Specification.
The allowable strength is: R2SF = RTM / SF2* (Eqn. 6)
For Method 2, the ratio of the allowable strength to the test average is: R2SF / RTM = 1 / SF2* (Eqn. 7)
The calculated resistance factor in Method 2 is denoted here as φ2 to distinguish it from the resistance factor (φ) used in Method 1.
φ2 = 1.5 MmFm / eψ (Eqn. 8)
For LRFD, φ2* is the lesser of φ2 and the applicable value of φ in the Specification.
The design strength is: R2Φ = φ2* RTM (Eqn. 9)
For Method 2, the ratio of the design strength to the test average is: R2Φ / RTM = φ2* (Eqn.10)
Safety Factors
Plots of calculated safety factors (SF2) and the required minimums are shown in Figures 2 through 5. Each plot is based on a different combination of βo, Mm, and VF. VF equals 0.05, except for Figure 5, where it is 0.15. SF2 decreases as N increases (CV constant) and as CV decreases (N constant) for all plots. For large N and small CV, the decrease in SF is imperceptible in the figures. In these figures, a small number of samples (combined with intermediate or large CV values), or a large CV, typically results in a relatively large SF2.
In each Figure, the range of calculated safety factors (SF2) is:
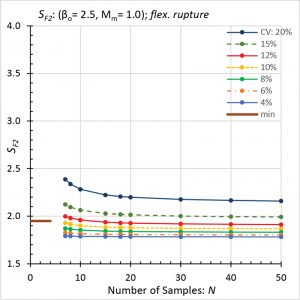
- Figure 2 (beam rupture): 2.39 to 1.78, but the required minimum is 1.95.
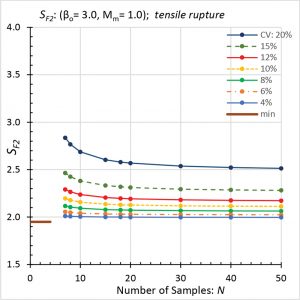
- Figure 3 (rupture of tension members): 2.84 to 2.00, which exceeds the minimum of 1.95.
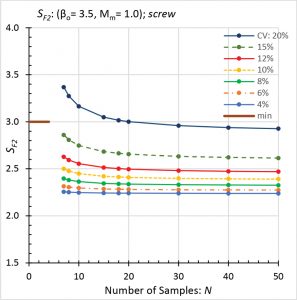
- Figure 4 (tapping-screw connections): 3.37 to 2.24, but the minimum is 3.0, which governs over most of the calculated values.
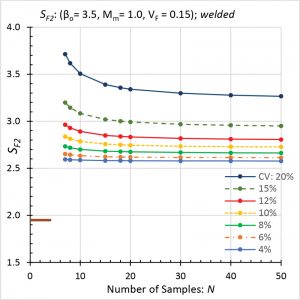
- Figure 5 (welded connections): 3.71 to 2.58, all of which exceed the minimum of 1.95.
Where a calculated safety factor (SF2) exceeds the corresponding minimum (Ω), then SF2* equals SF2. In this case, Method 2 determines an allowable strength that is less than RTM / Ω.
Resistance Factors
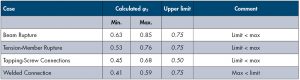
Plots are not shown for calculated resistance factors (φ2), but the Table provides a sampling of results for each condition.
If a calculated resistance factor (φ2) is less than the corresponding upper limit (φ), then φ2* equals φ2. In this situation, Method 2 provides a design strength that is less than φRTM.
For both ASD and LRFD in Method 2, the available strengths are based on the test averages. However, the main body of the Specification bases available strengths on nominal strengths (RN), which are in most cases less than test averages. This means that a test average divided by SF2* could produce an allowable strength that exceeds RN / Ω. Similarly, a test average multiplied by φ2* could result in a design strength that is greater than φRN.
Method 1 vs. Method 2
Note that KCV > 0 for CV > 0. Given this, Equation 2 (Method 1’s ratio of allowable strength to test average) is less than Equation 7 (Method 2’s ratio for allowable strength) if SF2* equals Ω. Similarly, Equation 4 (Method 1’s ratio of design strength to test average) is less than Equation 10 (Method 2’s ratio for design strength) if φ2* equals φ.
Acknowledgments
The author acknowledges the constructive comments during article preparation from J. Randolph Kissell, P.E., and Scott Walbridge, Ph.D., P.Eng.■
References
Specification for Aluminum Structures (Part 1 of the Aluminum Design Manual), The Aluminum Association, 2020
Commentary on the Specification for Aluminum Structures (Part 2 of the Aluminum Design Manual), The Aluminum Association, 2020
Galambos, T.V. (1979), Load and Resistance Factor Design for Aluminum Structures, Research Report No. 54, Washington University, St. Louis, MO; (for the basis of Method 2)
Goepfert, W.P. (1994), Statistical Aspects of Mechanical Property Assurance, Aluminum and Magnesium Alloys, ASTM v.02.02; (for Method 1)