
An Innovative Approach to Retrofitting Soft/Weak-Story Buildings
Engineers recognize that multi-unit, wood-framed apartment buildings with soft/weak stories are vulnerable to side-sway collapse from earthquakes. The risk was illustrated by the 6.7-magnitude 1994 Northridge quake and the 6.9-magnitude 1989 Loma Prieta quake (Figure 1). In the Northridge quake, for example, roughly 200 such buildings, containing thousands of units, suffered severe damage or collapse.
Although California cities aim to improve safety with incentives and mandatory retrofit ordinances, the problem is vast. Reliable design solutions have proved elusive, primarily because these buildings are old, weak, and irregular; they were constructed using archaic materials and outdated practices and, usually, there are no plans. The Federal Emergency Management Agency’s (FEMA) P807, Seismic Evaluation and Retrofit of Multi-Unit Wood-Frame Buildings With Weak First Stories, was created to help engineers fix such buildings.
The challenge is threefold. First, retrofits must be affordable, which essentially limits the work to the ground floor to avoid displacing tenants. Second, rapid adoption is essential given that thousands of buildings are affected, so designs should be relatively inexpensive for engineers to perform. Third, solutions must be reliable and effective to justify the massive effort.
This problem has parallels to the old construction adage: Good, fast, cheap: pick any two. Nevertheless, a team of collaborators and advisors, under the leadership of the Applied Technology Council, delivered on all three aspects of FEMA’s design mandate. The team developed guidelines for inexpensive ground-floor retrofits that are easy to design and that perform well. It also created numerous innovative techniques for solving the problems typically associated with such work. The result is an approach called Prescriptive Performance-Based Design.
This strategy includes four breakthroughs: 1) utilizing nonstructural finishes; 2) optimizing the ground-story mechanism; 3) leveraging extensive nonlinear response-history analyses to predict real building results using previously analyzed surrogate structures; and 4) creating and using custom software to find relevant answers quickly.
Observations and Patterns
Buildings with soft/weak ground floors have two distinct parts. The strong but brittle upper portion, which contains housing units, is supported on a weak, brittle, and often torsionally irregular base. As in the damaged apartment building in Figure 1, weak ground floors may accrue significant damage from seismic forces, with resulting dramatic displacement or collapse.
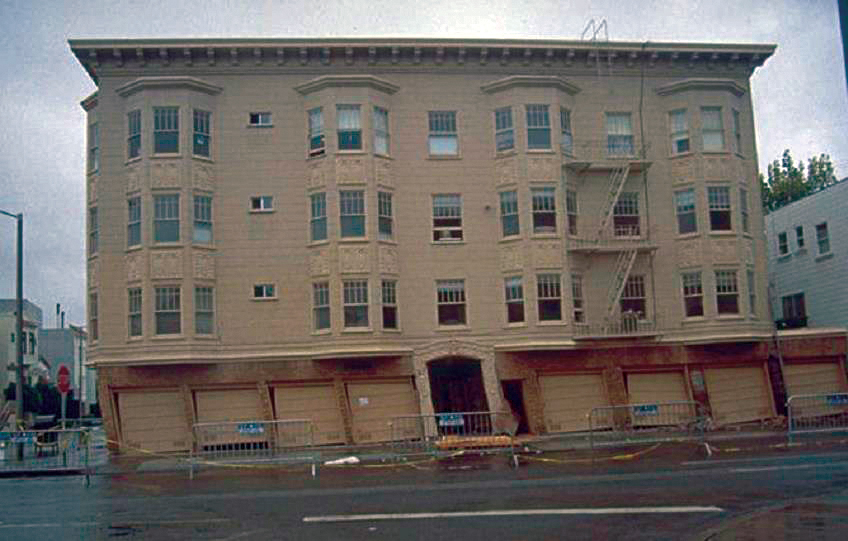
Figure 1. Building damaged in 1989 Loma Prieta earthquake. Courtesy of Raymond B. Seed.
Nevertheless, the weak ground floor also acts to some extent as a base-absorption system, protecting the upper (occupied) floors from more extensive harm. Note the lack of damage to the upper structure in Figure 1, despite that nothing from the second floor up would traditionally be considered structurally significant. The building was constructed in the 1940s using stucco, lath-and-plaster, and other contemporary materials; it is unlikely that there is a conventional load path or that any interconnecting metal hardware was used. The upper structure’s strength, in fact, derives from its multiple interconnected nonstructural walls. This capacity is significant, and one of FEMA P807’s innovations is that it brings into retrofit calculations all such walls and their sheathing layers, both structural and nonstructural.
The Relative Strength Method
Although cost-effectiveness dictates that retrofits be limited to the ground floor, this strategy poses practical challenges. In response, the team developed the “Relative Strength Method,” which aims to optimally strengthen the ground floor – enough, that is, but not so much that its base-absorption mechanism is compromised. In this method, the upper stories establish the building’s upper limit of retrofitted strength, while ground-story retrofits add both strength and displacement capacity while reducing torsion to the building overall. This solution keeps the retrofitted ground story relatively weaker than the upper structure; that is, the ground story maintains its function as a deformation absorption level.
Surrogate Structures
To prove the robustness of the Relative Strength Method and to efficiently leverage the power of nonlinear response-history analyses, the team studied an extensive family of surrogate structures. The bulk of these were simple four-story nonlinear models with varied parameters for upper-structure strengths, ground-floor weakness, hysteretic behavior (to account for brittleness), and levels of retrofit. Once the team had established these parameters, it set out to determine, experimentally, how they all interacted under a variety of scaled earthquake simulations. The simple but powerful idea is that engineers can use previous analysis results to evaluate a particular surrogate structure as a means of understanding the behavior of a corresponding real building.
Selecting the appropriate surrogate is based on matching key parameters. Engineers can simply borrow the predetermined analysis results rather than having to evaluate each real-world building independently. This works to determine both the original capacity of a structure and to select its optimal retrofit.
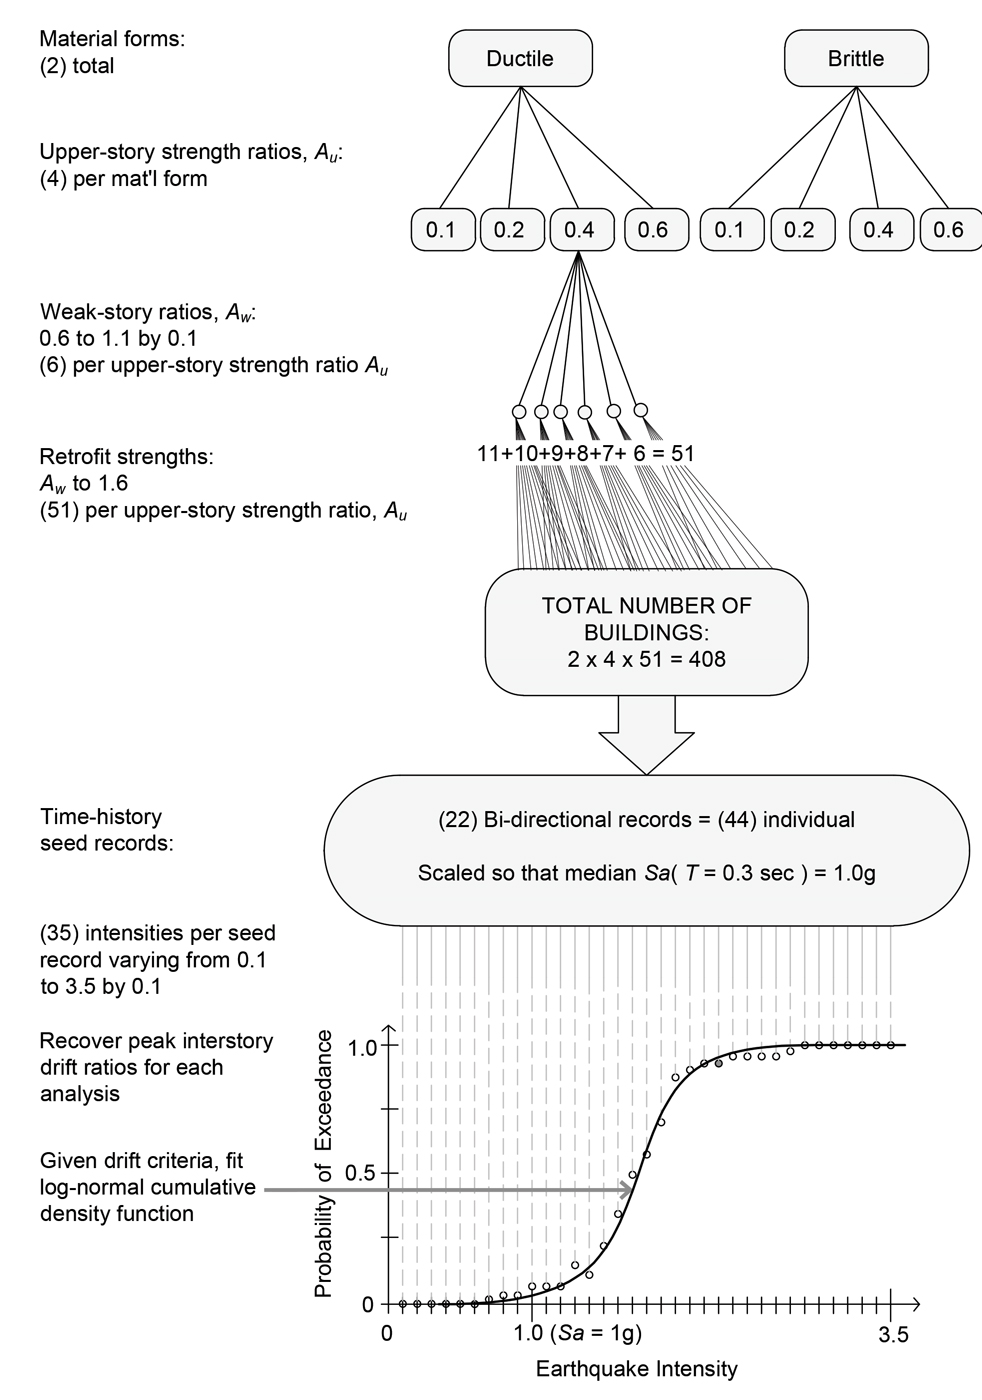
Figure 2. The surrogate structures subjected to Incremental Dynamic Analyses (IDA).
To create the surrogate structures, the team started with two broad categories of buildings: one ductile, one brittle. Each of those two categories had four levels of lateral strength assigned to the upper floors, expressed as percentages of G-forces (Figure 2). Each of those upper-floor categories was then assigned six strengths for the weak ground story, ranging from 60 percent to 110 percent of the upper-story strength. Then, each of those weak-story ratios was given various levels of simulated retrofit strengths. There are 612 virtual surrogate buildings shown in Figure 2. Each was subjected to Incremental Dynamic Analyses (IDA) per the FEMA P695 protocol; these consisted of 22 earthquakes in each of two directions, at 35 intensity levels. This yielded roughly a million nonlinear response-history analyses.
Thanks to these IDAs, engineers can now determine which intensities of seismic shaking would cause catastrophic damage to a given building. They can also assess what amount of retrofit strengthening achieves maximum benefit.
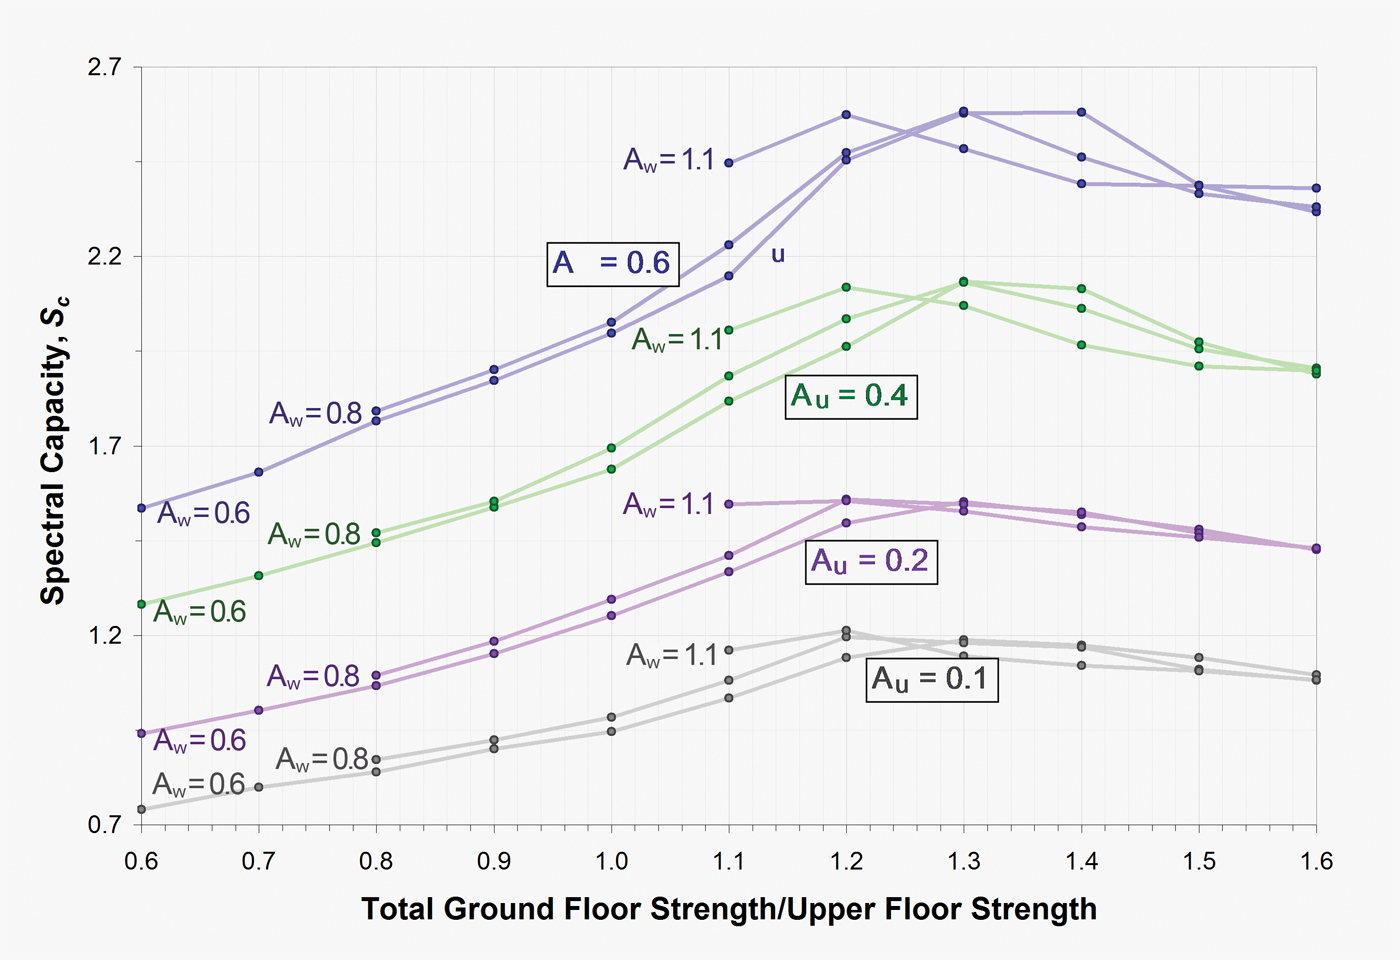
Figure 3. “Sweet Spot” based on analysis results for all surrogate structures.
As noted earlier, this work would be constrained to the ground floor. Over-strengthening the lower stories to the point that the upper structure cannot sustain the transmitted seismic forces entails needless expense and actually reduces the building’s overall capacity, as shown in Figure 3. The vertical axis is Spectral Capacity, representing the building’s seismic capacity. The horizontal axis is the ratio of ground-story capacity to upper-story capacity. The families of buildings with different upper-structure strength are represented by one of four colors, noted by Au. The Au = 0.6 family, shown with blue lines, is the strongest, with an ultimate lateral capacity 0.6 W (60% of the building’s weight). The Au = 0.1 family, shown with gray lines, is the weakest. The lines of each family are anchored with their unretrofitted capacity, noted with the coefficient Aw, representing the ground floor strength as a fraction of the upper-structure strength (Au). Aw = 0.6 corresponds to an unretrofitted structure with a ground floor that is 60% as strong as the upper structure. Each subsequent point on the line represents an additional level of retrofit strength that would result from adding more plywood shear walls or steel moment frames to the ground floor.
Figure 3 reveals a “sweet spot” of optimal strength. It applies to any family of upper-story strength Au, and any level of initial ground story weakness Aw. The optimal ratio of ground-story strength to upper-structure strength, for four-story buildings, is roughly 1.33 or 4/3. (The optimal capacity is reached when the relative demands on the ground story and the second story are the same.) The ground story carries four levels and the second story carries three levels. When the strength ratio is less than 4/3, the ground story is the weak link in the chain, where the story mechanism will occur. When the strength ratio is greater than 4/3, the second floor is the weak link, and the loads flow through the ground story and damage the second story.
Nuts and Bolts
FEMA P807 is a practical tool to determine how strong a given building is, both before and after retrofit, by evaluating a few key parameters. Using these parameters, engineers can compute the optimal retrofit so that a building absorbs and filters seismic forces at the ground level, without transferring so much of those forces upward that they would either damage the higher floors or necessitate the costly retrofitting of them. The critical structural coefficients are the following:
- Ground-story strength
- Upper-story strength
- Upper-to-ground story strength ratio
- Coefficient for Strength degradation
- Coefficient for Torsional imbalance
On the capacity side, engineers can tap into the previously performed analyses using simple formulas. On the demand side, USGS maps are used to determine the short period demands for the Maximum Considered Earthquake (MCE) hazard (2% chance of exceedance in 50 years).
Calculating the key parameters means finding the strength at each story. This is conceptually simple, but it requires pushover analyses (Figure 4).
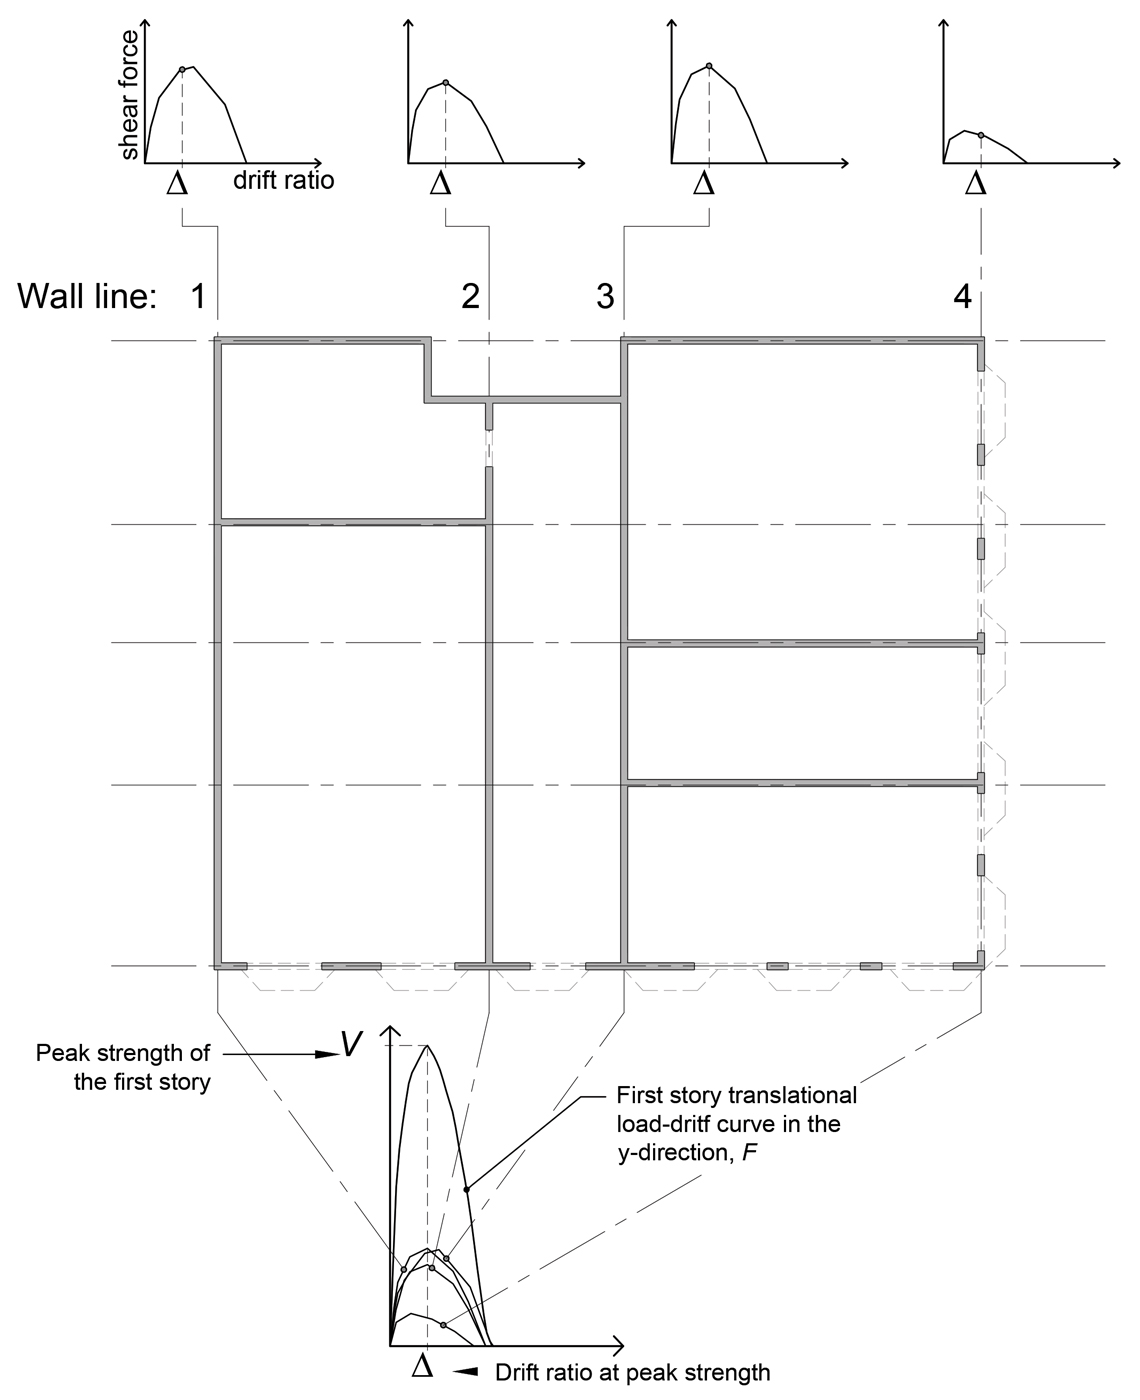
Figure 4. Adding wall pushover curve to find the story pushover curve and peak strength.
This is a departure from traditional design for several reasons. First, as noted previously, all sheathing is counted, in both structural and nonstructural elements. Omitting walls or finishes is not conservative. Furthermore, capacities can be assessed only by adding pushover curves for the walls since different sheathing elements reach peak capacity at different displacements. The parameter for the Strength Degradation, Cd, is based on the shape of the ground-floor pushover curves. Finally, the torsional coefficient is derived from the ratio of torsional strength demand to that of torsional capacity.
It is essential to note that the parameters are all based on expected strengths. Moreover, unlike traditional design, stiffness does not affect the results because the behavior is dominated by the strengths in the nonlinear region of the building’s response.
Software to Keep It Simple
Creating pushover results without automation is challenging given that multiple walls are involved. The Weak-Story Tool (WST) is a graphical spreadsheet that simplifies adding walls and generating pushovers. To find any wall capacity, engineers can create the wall assembly using drop-down menus to account for all the elements of exterior and interior walls – stucco, horizontal wood siding, drywall, and so forth. Next, engineers can draw the walls on the graphical spreadsheet (Figures 5 and 6). The software will superimpose the pushover curves for the various walls. When all the walls are drawn, and everything is figured in, the engineer has not only all the story strengths but also values for the overall strengths, the strength degradation coefficients, Cd, and the torsional demand and capacity.
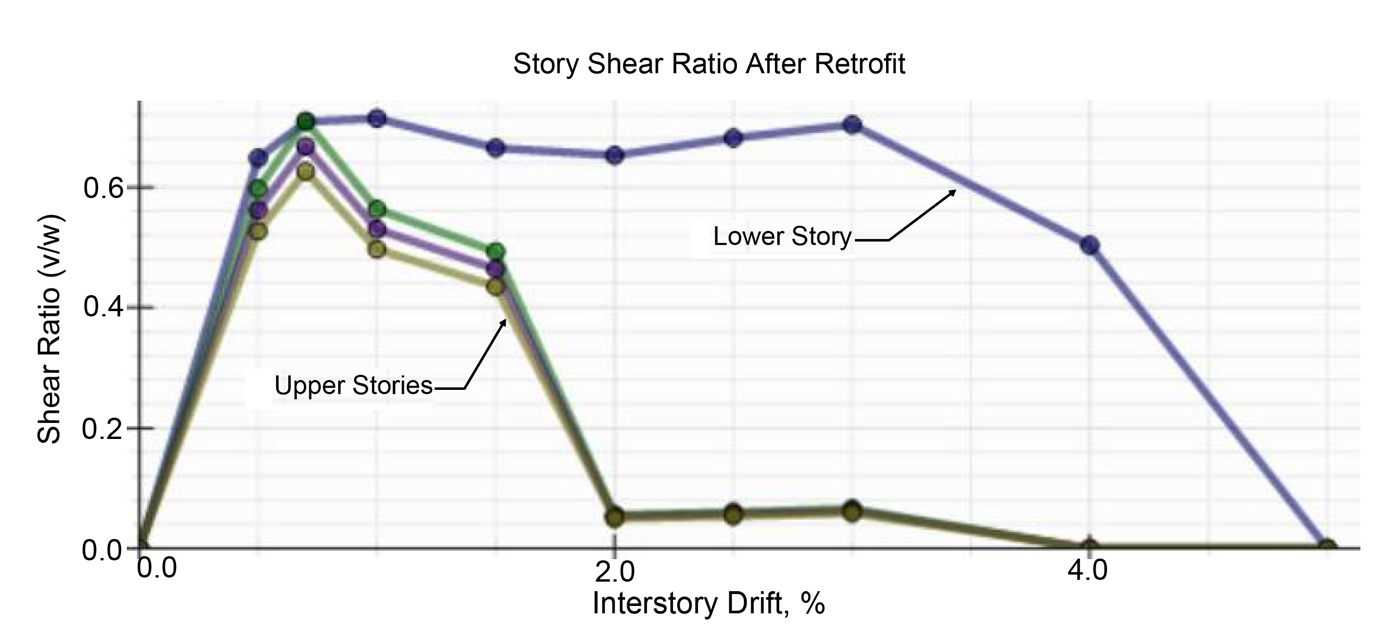
Figure 5. Walls of Level 1 in the Weak Story Tool’s graphical spreadsheet.
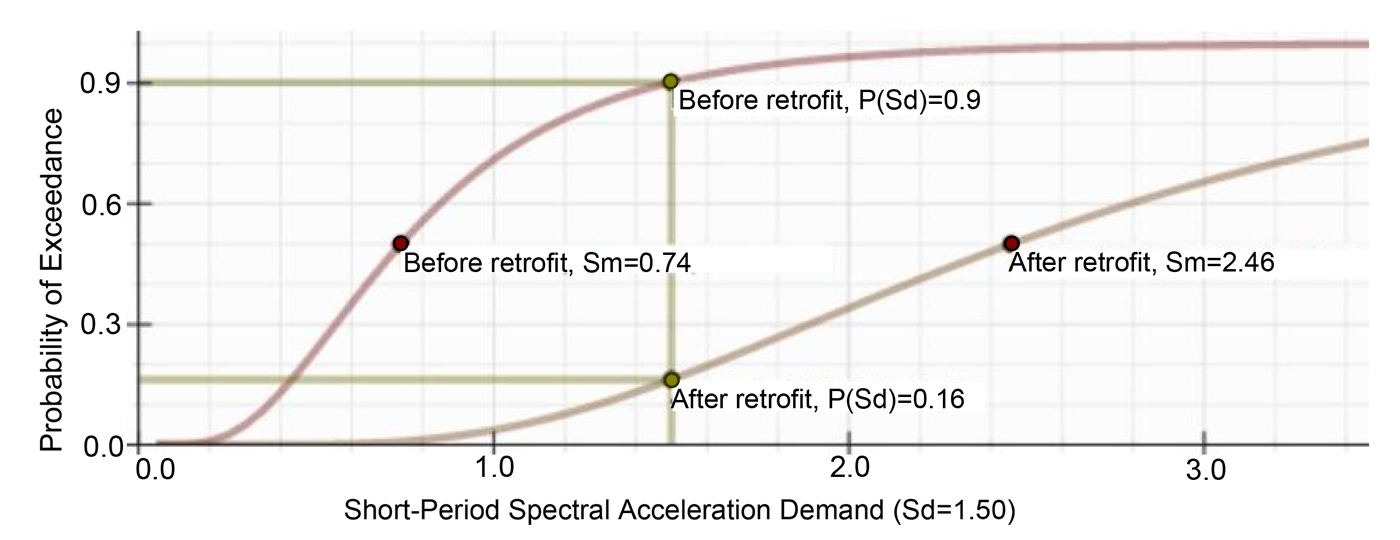
Figure 6. Walls of Level 2 in the Weak Story Tool’s graphical spreadsheet.
Once the engineer has used the WST’s pushover features to determined capacities, he or she can determine the demands (Sm for the Maximum Considered Event (MCE)) by inputting the building’s zip code. If the real-world building turns out to be strong enough, retrofitting will be unnecessary; if it is not, the WST indicates the strength required to yield the optimal retrofit.
The retrofits would be composed of either new structurally-sheathed walls (plywood or oriented strand board [OSB]), or new steel moment frames. These elements are expected to yield and go well into the nonlinear range during a major earthquake. As such, capacity design needs to be employed for the collectors, the members, and the foundations. The capacity of new elements (walls and frames) are input using backbone curves that reach ultimate values. For frames, the engineer can input custom backbone curves. Simpson Strong-Tie also has software for their Strong Frame that has been integrated with the WST.
The results, before and after retrofit, are expressed in probabilistic terms. For example, a building may have a 90% chance of exceeding its dangerous drift threshold during the MCE. After retrofit, the improvement may be expressed as achieving only a 16% chance of exceeding the drift threshold. This sets up a useful conversation between engineers and stakeholders, capturing the benefit in real terms rather than with the abstract concept of being code compliant or not.
Shake Table Validation
Two different retrofit designs, based on the Relative Strength Method and FEMA P807, were validated on a shake table at the University of California San Diego as part of the Network for Engineering Simulation (NEES)-Soft program (Figure 7). One design featured cross-laminated timber (CLT) shear walls; the other featured Simpson Strong Frames. In both cases, the four-story retrofits performed well. Deformations occurred primarily at the ground story, with little damage to the upper structure. After the successful tests with the retrofits, the structure was restored to the unretrofitted condition, where it collapsed under intense shaking.
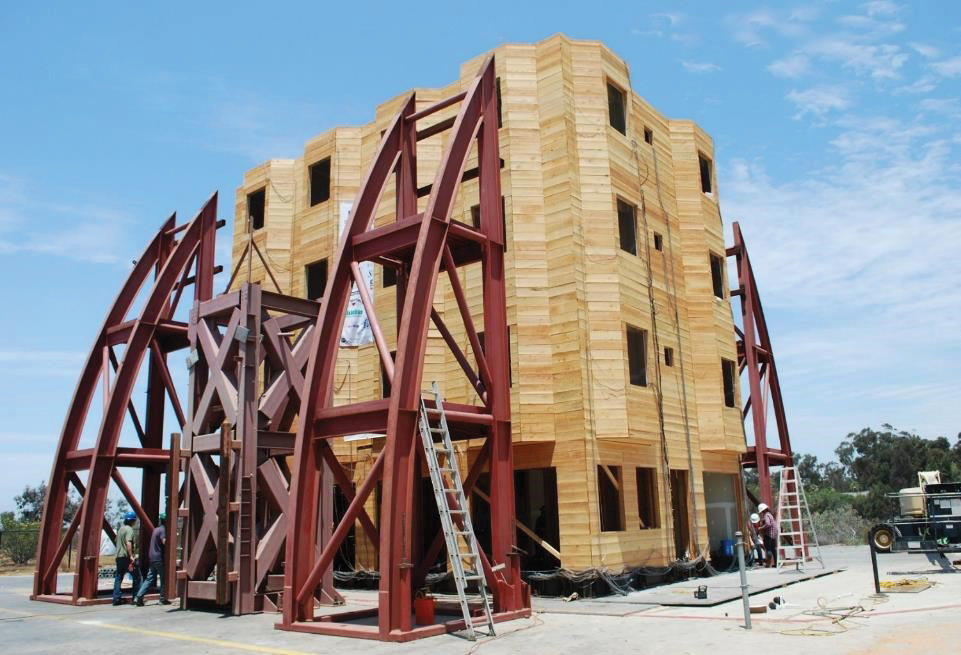
Figure 7. Shake table testing at UC San Diego, as part of the NEES-Soft program.
Conclusion
Following the Northridge and Loma Prieta earthquakes, and in anticipation of potentially greater quakes to come, California and other states have undertaken plans to strengthen vulnerable weak/soft-story buildings. FEMA P807 offers a practical approach to cost-effective retrofits. Prescriptive Performance-Based Design, coupled with the Weak Story Tool software, should ideally simplify and expedite the evaluation and retrofitting of wood-framed, weak-story buildings throughout the region.
What’s important – and new, resulting from the Incremental Dynamic Analyses – is that, for these buildings, engineers and stakeholders can now discover the level of earthquake intensity that will cause catastrophic damage or collapse. Moreover, engineers can quantify for clients to what extent investing in a retrofit will reduce these risks.■