
Most building codes worldwide have been developed to protect building occupant health and safety under likely loading, including earthquakes. Severe wind, snow, and live loads frequently occur during a building’s life. Therefore, in addition to protecting life safety, code requirements for these loads also result in a very low probability that buildings will be damaged by these loads. Earthquakes, however, occur rarely and most buildings never experience a significant earthquake. Therefore, building codes do little to limit building damage, repair cost, and building closure time resulting from expected design-level events. Recent studies of code-compliant buildings indicate they may be closed for six to 24 months after a design level earthquake, and demolished after a maximum considered earthquake. Essentially, we are designing “safe but disposable” buildings. Can we do better?
In the period from 1971-1994, California experienced damaging earthquakes somewhere in the state every 18 months or so. These frequent and substantial losses prompted owners to ask engineers to evaluate and upgrade existing buildings to perform better, but engineers had no tools to do this. The Federal Emergency Management Agency (FEMA) initiated a series of projects with the Applied Technology Council (ATC) that culminated in 1997 with the publication of FEMA 273/274, Guidelines for Seismic Rehabilitation of Buildings. This landmark document, which has since evolved into the ASCE 41 standard, formed the first generation of true performance-based seismic design criteria. However, owners also wanted better performing new buildings and FEMA 273/274 applied only to existing buildings. Engineers began to demand similar procedures for the design of new buildings. FEMA again turned to ATC to respond to this need and funded development of the FEMA P-58 methodology through the ATC-58 project series, which ultimately required more than $16 million in funding and produced a comprehensive risk assessment methodology applicable to both new and existing buildings.
Early in the development process, ATC solicited input from stakeholders including engineers, owners, building officials, insurers, and lenders. These stakeholders indicated that, rather than discrete performance levels inherent in ASCE 41, it would be preferable to acknowledge the continuous range of performance buildings experience, to be quantitative in the description of this performance, and to acknowledge the uncertainties inherent in assessing building performance in future events.
The FEMA P-58 method provides quantitative descriptions of building performance in terms of repair cost, repair time, life safety, occupancy, and environmental impacts. It is building-specific and can be used iteratively to design buildings with desired performance, just as engineers use structural analysis software to design buildings for code compliance (where the goals are limiting drifts, making components strong enough, etc.). It can also be used to assess the risk of an existing building.
Overview of the FEMA P-58 Method
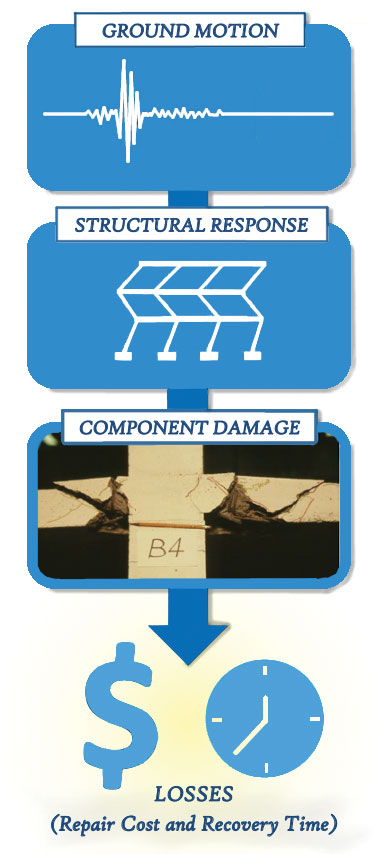
Figure 1. Overview of the FEMA P-58 analysis method.
Figure 1 shows major steps in the P-58 process:
- Ground Motions. Expected ground motion intensities are quantified using seismic hazard analysis (or default U.S. Geological Survey data). This step may also include a selection of ground motions if required for structural analysis (Step 2).
- Structural Response. Building response quantities are computed for each ground motion level of interest. These include peak story drifts and floor accelerations, residual story drifts, and other predictive parameters. This step can be completed using either response-history analysis or linear static response prediction approaches calibrated to nonlinear analysis based on building strength and modal properties.
- Component Damage. Damage to individual structural and nonstructural components is computed by combining the structural responses with fragility (damage) functions (e.g., functions for partition walls that relate story drift to wall damage). This step is supported by a comprehensive database of fragility functions provided in the FEMA P-58 documentation.
- Losses and Repair Times. First, repair costs and repair times are computed for each component based on the predicted damage; then these are aggregated to compute total repair cost and repair time for the building. Repair costs include regional modifiers to reflect construction costs by region and do not typically include post-earthquake demand surge (though that could be included).
These four steps of the FEMA P-58 method are combined using Monte Carlo simulation, such that the uncertainties are tracked and the risk predictions quantified by mean values and variability.
Some highlights of the FEMA P-58 method are:
- In addition to safety metrics, FEMA P-58 predicts important metrics of building resilience including repair cost, repair time, and potential occupancy tagging
- FEMA P-58 predicts building-specific risk using a quantitative engineering-based assessment process, in contrast to most other loss prediction methods that are empirical or judgment-based, and uses building class rather than building-specific information.
- FEMA P-58 is open-source, standardized, and repeatable, with the assessment process supported by a wide range of databases created in the project (fragility functions, loss functions, etc.).
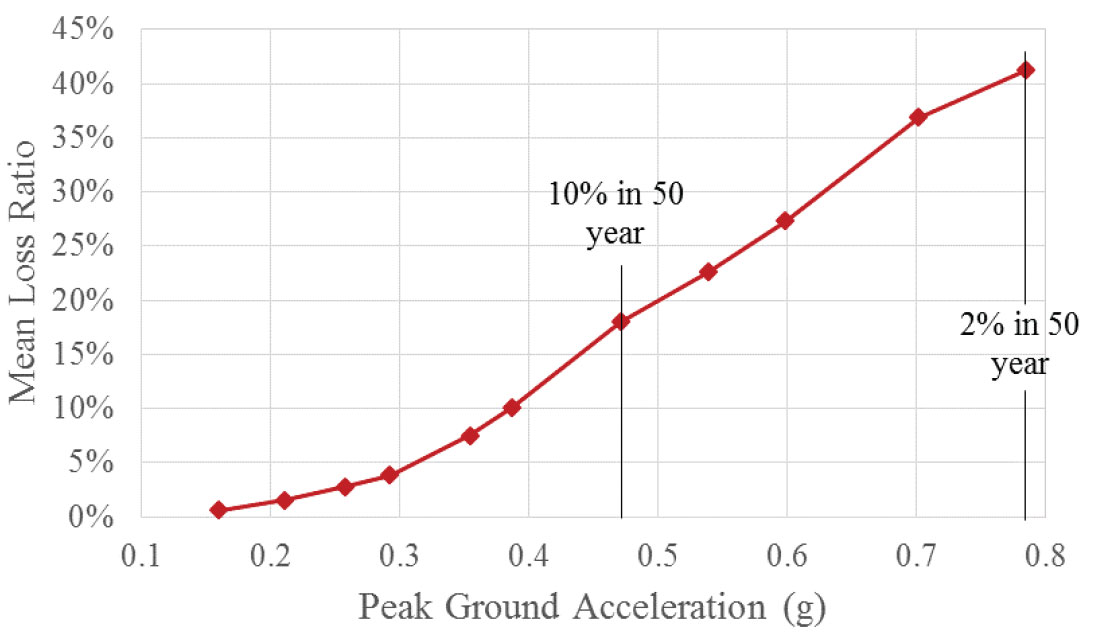
Figure 2. Example mean repair cost curve predicted by FEMA P-58 analysis.
Figure 2 provides a loss vulnerability curve for an example mid-rise office building in Los Angeles with a reinforced concrete frame. For this example, the 10% in 50-year and 2% in 50-year ground motions produce 0.47g and 0.78g peak ground accelerations and mean repair costs of 18% and 42% of replacement cost, respectively. FEMA P-58 also provides full statistical distributions of losses and repair times (e.g., 90th percentiles, etc.).
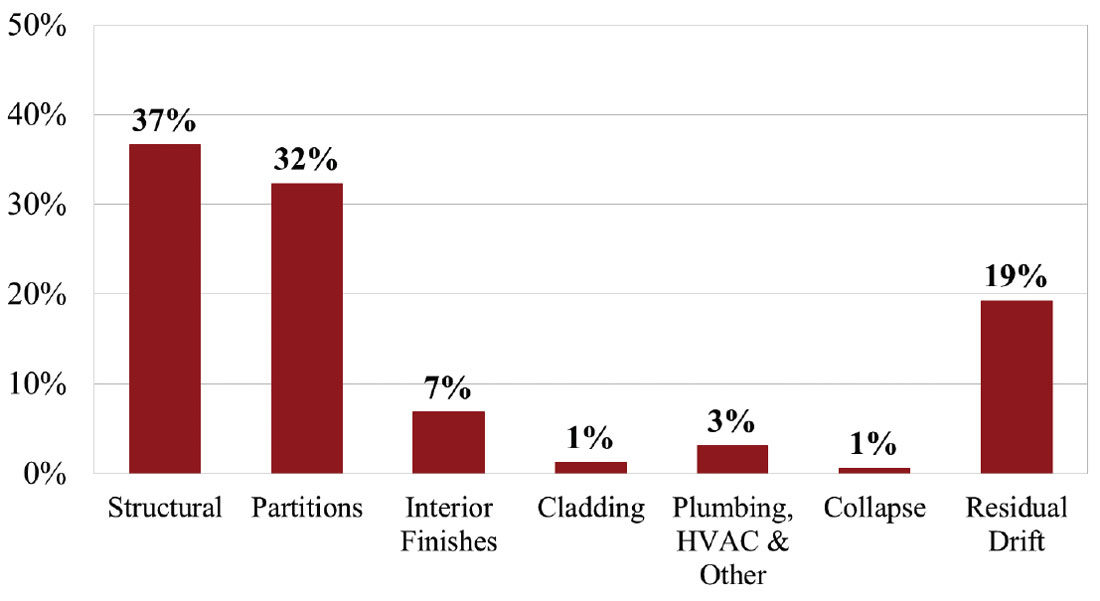
Figure 3. Breakdown of repair cost sources for a 10% in 50-year level earthquake motion.
In addition to the aggregated results of Figure 2, FEMA P-58 also predicts repair costs for specific components. Figure 3 shows a breakdown of repair costs for 10% in 50-year ground motion for the same example building. In this case, two-thirds of the loss comes from items other than structural damage, with significant contributions from partitions and finishes as well as some contribution from excessive post-earthquake drift (“residual drift”), indicating that the building would need to be demolished.
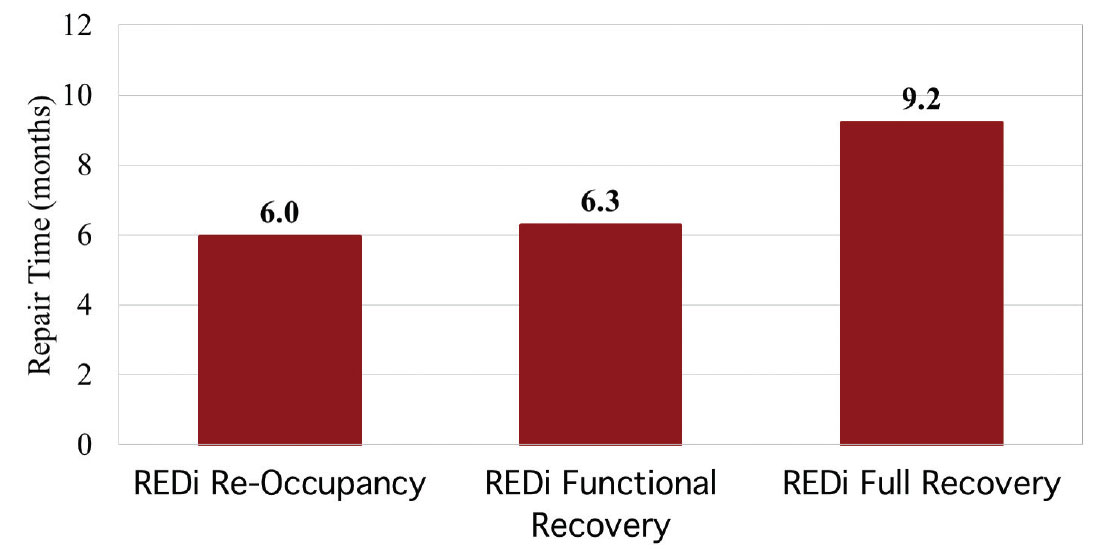
Figure 4. Building closure and repair times for a 10% in 50-year level earthquake motion.
FEMA P-58 also provides detailed information on repair times, which is useful for predicting building closure and business disruption. Companion methods, like the Resilient Design Initiative (REDi) build on FEMA P-58 to provide enhanced repair time estimates. Figure 4, constructed using the REDi procedure, shows the expected repair times for the same 10% in 50-year ground motion level and predicts that it will take six months to reoccupy the building and nine months to have the building restored to pre-earthquake conditions.
The FEMA P-58 method enables the quantitative resilient design of buildings but is equally applicable to risk assessment of existing buildings (and is commonly used for existing buildings as well).
Recent Developments that Build upon FEMA P-58
The debut of P-58 in 2012 spurred additional research and development to extend and enable effective use of the method. Examples include the Resilient Design Initiative (REDi) system in 2013 and the U.S. Resiliency Council (USRC) rating system in 2015 – two systems that provide building ratings based in large part on FEMA P-58 calculations. The Seismic Performance Prediction Program (SP3) software was created, and released in 2014, to enable efficient use of the FEMA P-58 method. Additionally, the National Science Foundation has funded the extension of FEMA P-58 to cover other structural systems, including tilt-up buildings.
Uses for FEMA P-58 and Case Studies
FEMA P-58 enables engineers to provide a wide range of new services, listed here and illustrated in the following sections.
- Resilient design of new buildings
- Retrofit of existing buildings
- Risk assessment for mortgage (PML+), insurance, and investment decisions
- Risk assessments of special facilities that require post-earthquake operability
Quantitative Resilient Design
Traditionally, engineers make a building “better” by adding strength or stiffness, or by designing to a higher performance objective (say the immediate occupancy objective using ASCE 41). The result can be difficult to sell to clients, however, because it is hard to quantify the effects of better design. FEMA P-58 enables structural engineers to quantify the results of better design, in terms that more building owners care about and understand.
Exact design requirements will depend on the circumstance. Common goals are:
- Avoid structural damage, and limit residual drifts, to ensure post-earthquake functionality (i.e., no red tag and no damage would require structural repair).
- Prevent damage to non-structural drift sensitive components that would inhibit building functionality.
- Prevent damage to acceleration sensitive components that would inhibit building functionality, including equipment and their anchorages.
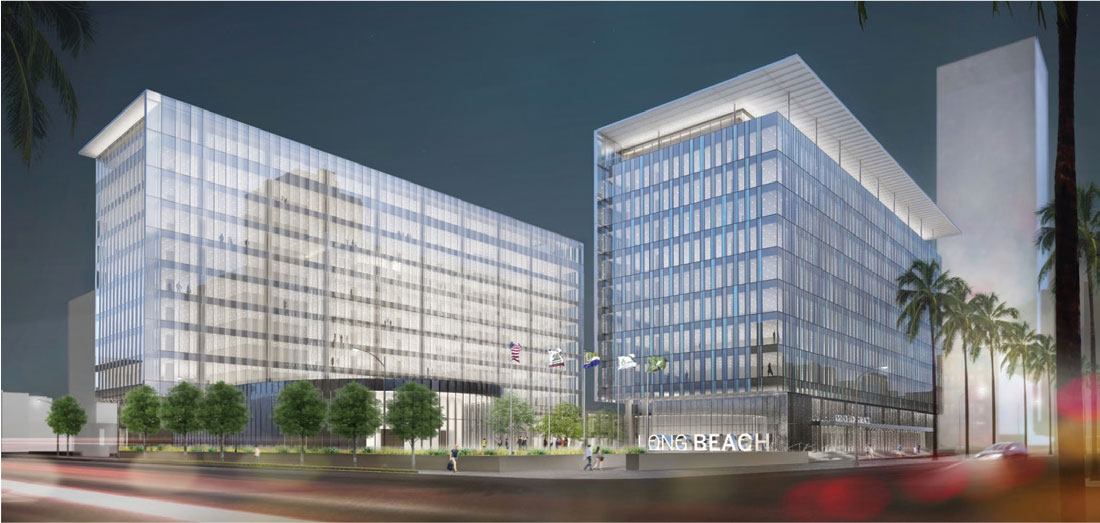
Figure 5. Rendering of the Long Beach Civic Center, which was designed iteratively using FEMA P-58. Courtesy of Skidmore Owings & Merrill and SEOAC paper.
Figure 5 shows an example of a recent resilient design project, the Long Beach Civic Center (LBCC) in Southern California (with information coming from the 2016 Structural Engineers Association of California, SEAOC, convention). This complex includes an 11-story building for the City of Long Beach, an 11-story building for the Port of Long Beach, and a one-story city council chambers. This project was designed with the collaboration of Nabih Youssef and Associates and Skidmore Owings & Merrill. The overall resiliency goals for this design included the following performance goals for 10% in 50-year ground motion:
- Safe (code-compliant, low risk of fatality or injury)
- Repair cost < 5% of building value
- Re-occupancy time < 1 week
- Complete recovery time < 1 month
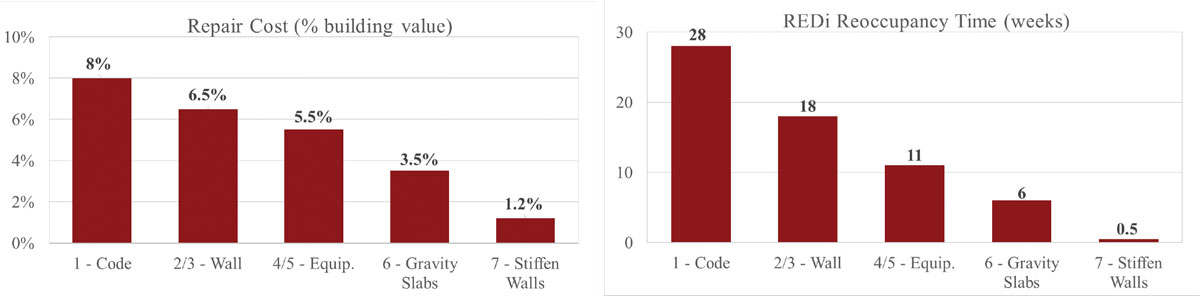
Figure 6. Example resilient design showing approximate (a) reduction in repair cost, and (b) reduction in REDi re-occupancy time.
The designs of the LBCC buildings were driven directly by iterative FEMA P-58 analysis and redesign. The list below outlines the primary design steps. Figure 6 shows approximately how the repair costs and repair time dropped as each of the resilient design steps where implemented:
Step 1: Decide to use a reinforced concrete core wall and start with a code-compliant design.
Step 2: Increase wall strength to limit flexural damage such that repair is not required.
Step 3: Remove coupling beams (and instead use a punched wall design) such that coupling beams do not require repair.
Step 4: Ensure equipment is functional through strengthening anchorages and prequalifying important equipment.
Step 5: Strengthen one elevator to ensure post-earthquake functionality.
Step 6: Reduce the shear stress in the gravity slab-column connections to limit their damage.
Step 7: Stiffen structural walls (to meet a 1% drift target) to further protect slab-column connections and to protect partition walls.
Exact cost comparisons for this building are not yet available, but other similar projects suggest that this type of resilient design only costs 1-3% more than a baseline code-compliant design.
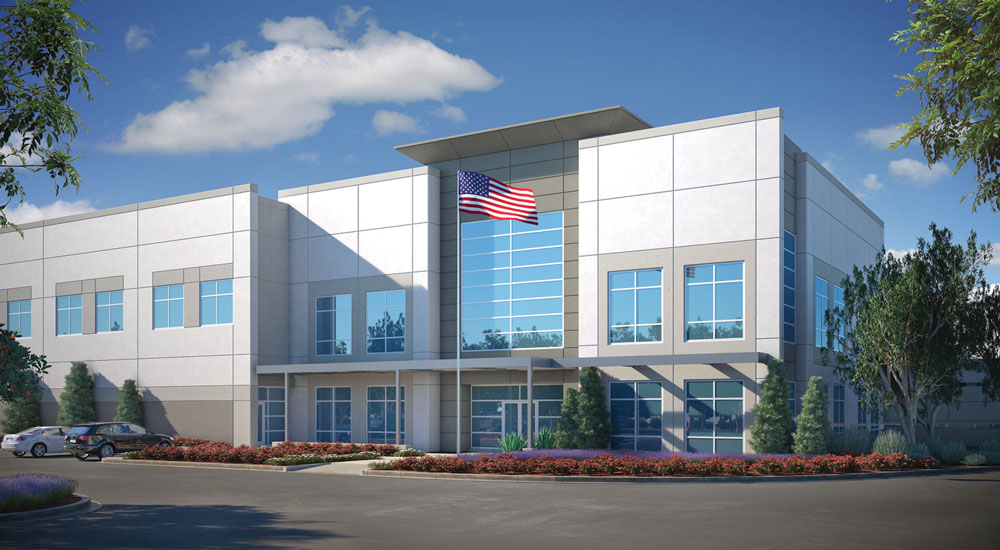
Figure 7. Rendering of Watson Land Company commercial tilt-up building, designed using an ASCE 41 Immediate Occupancy objective, with a reduction in risk quantified using FEMA P-58. Courtesy of Watson Land Company.
Figure 7 shows a commercial property developed by Watson Land Company. Watson Land Company develops and leases their properties and has been designing its properties to exceed minimum requirements for many years as a means of creating more marketable properties, reducing the chance that occupants will be displaced after an earthquake, and reducing required earthquake insurance costs. This building was designed for an Immediate Occupancy objective using ASCE 41. FEMA P-58 is being used to quantify the risk reduction in terms of reduction in dollar losses, which will provide a stronger basis for pursuing an insurance benefit. The current FEMA P-58 study is comparing the repair costs for the Immediate Occupancy (IO) design to those of a typical code-compliant design (for a 10% in 50 year ground motion level) and is finding that the repair costs for the IO design are only half of the repair costs for a typical code-compliant design, but the study is ongoing. When comparing the resilient design to a typical code-compliant design, the building only cost $1.27 more per square foot.
Building-Specific Risk Assessment
The same FEMA P-58 method is regularly used to complete high-resolution building-specific risk assessments of existing buildings, for a wide range of purposes (retrofit decisions, mortgage risk assessments, insurance risk assessments, investment risk assessments, etc.).
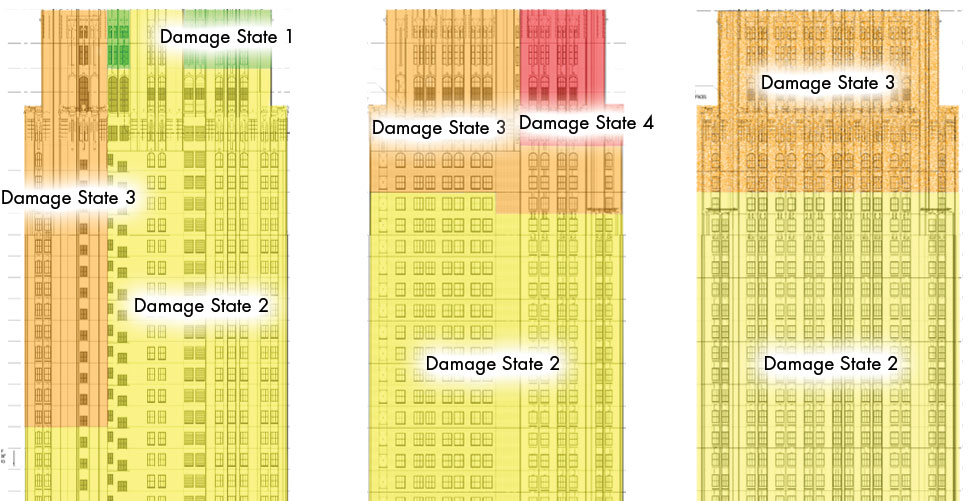
Figure 8. Image of damage predictions for historic façade using FEMA P-58, done as a part of a comprehensive risk assessment of this building, in support of a purchase decision.
Figure 8 shows an example assessment completed to support a possible building purchase decision. This is an older building that had been structurally upgraded, but which still has older and brittle unreinforced masonry cladding. A full FEMA P-58 assessment was completed by Holmes Structures to estimate building damage and repair costs at multiple levels of ground motion. Damage to the brittle cladding was a critical component, and Figure 8 illustrates the expected damage states of the cladding on multiple elevations of the building (for a 10% in 50-year ground motion).
Conclusions
The FEMA P-58 assessment methodology represents a great leap forward in capability to quantify and improve earthquake performance. By linking specific building properties to repair cost and repair time, society can better understand and manage earthquake risks. The examples above show how engineers are using this tool to design resilient buildings and to better quantify the risks posed by existing buildings. Based on the first five years of experience with this tool, evidence shows that new buildings can be designed with greatly improved performance at a very low-cost premium. With each passing year, further research and advances, such as new software tools and rating systems, continue to make this approach more accessible and useful. Engineers can look forward to a day when all building owners and insurers understand their earthquake risk, and when all new buildings are designed to be seismically resilient.▪