
Designing for blast loading.
This article focuses on the structural aspects of designing for blast resistance. This involves quantifying blast overpressures from accidental explosions and establishing design blast loads from these overpressures. This article provides a guide for design engineers and others to design new blast-resistant buildings and evaluate existing buildings for blast resistance. It provides the basic considerations and principles involved in determining blast loads on buildings.
Blast Wave Parameters
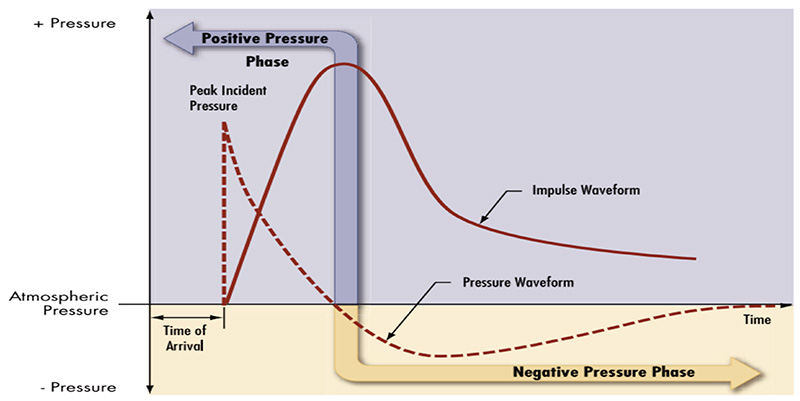
For blast-resistant design, the most significant feature of an explosion is the sudden release of energy to the atmosphere, which results in a pressure transient, or blast wave. This has a sudden, almost instantaneous rise in pressure above ambient atmospheric conditions to a peak free field (side-on or incident) overpressure. The peak side-on overpressure gradually returns to ambient with some highly damped pressure oscillations. This results in a negative pressure wave following the positive phase of the blast wave. Side-on pressure refers to the rise in pressure above ambient produced by a shock wave sweeping unimpeded across any surface (walls or roof) not facing the blast source.
The integrated area under the pressure verse time function is known as the impulse:
I = ∫P(t)dt
I = impulse (pounds per square inch-milliseconds (psi-ms) or megapascals-milliseconds (MPa-ms)
P = Pressure (psi or MPa)
T = time (ms)
Impulse is a measure of the energy from an explosion imparted to a building. Both the negative and positive phases of the pressure-time waveform contribute to impulse. Figure 1 shows how impulse and pressure vary over time from a typical explosive detonation.
Blast Wave Parameters for Blast Loading
The principal parameters of the blast wave required to define the blast loading for the building’s components are:
– Pso Peak side-on positive overpressure
– td Positive phase duration
– Io Corresponding positive impulse
– Pso− Peak side-on negative pressure (suction)
– td− Negative phase duration
– Io− The associated negative impulse
– Pr Peak reflected pressure
– qo Peak dynamic (blast wind) pressure
– U Shock front velocity
– Lw Blast wavelength
Peak Reflected Pressure, Pr
Upon encountering a surface, the free field blast wave generated by an explosion undergoes reflection. This phenomenon causes the surface to experience significantly greater pressure than the incident side-on value. Typically, the reflected pressure magnitude is determined by an amplifying ratio of the incident pressure:
Pr = Cr Pso , Cr = Reflection coefficient
For peak overpressures up to 20 psi (138 kPa), the expected range for most accidental vapor cloud explosions, Newmark provides a simple formula for the blast wave reflection coefficient at normal direction to the surface as follows:
Cr = Pr / Pso ≈ (2 + 0.05 Pso) (Pso in psi)
Cr = Pr / Pso ≈ (2 + 0.0073 Pso) (Pso in kPa)
Dynamic (Blast Wind) Pressure, qo
This blast effect is due to air movement as the blast wave propagates through the atmosphere. In the low overpressure range with normal atmospheric conditions, the peak dynamic pressure, qo, can be calculated using the following empirical formula from Newmark:
qo = 2.5 Pso / (7 Po + Pso) ≈ 0.022 Pso2 (psi)
qo = 2.5 Pso / (7 Po + Pso) ≈ 0.0032 Pso2 (kPa)
where, Po = ambient atmospheric pressure. The net dynamic pressure on a structure is the product of the peak dynamic pressure, qo, and a drag coefficient, Cd. The drag coefficient depends on the shape and orientation of the obstructing surface. For a rectangular building, the drag coefficient may be taken as +1.0 for the front wall and −0.4 for the side and rear walls and roof. Please note, the net dynamic pressure, in turn, will be added to the blast pressure to get the total pressure on walls; please refer to the sections later in this article for front, side and rear walls.
Shock Front Velocity, U
In the free field, the blast wave from an explosion travels at or above the acoustic speed of the propagating medium. In the low-pressure range and for normal atmospheric conditions, the shock/pressure front velocity in the air can be approximated using the following relationship from Newmark:
U ≈ 1130 (1 + 0. 058 Pso)0.5 (ft/s)
U ≈ 345 (1 + 0.0083 Pso)0.5 (m/s)
Blast Wave Length, Lw
The propagating blast wave at any instant in time extends over a limited radial distance from the explosion source. The pressure is largest at the front and trails off to ambient over a distance, Lw, the blast wavelength. Values of Lw for high-energy explosives can be obtained from UFC 3-340-02. In the low-pressure range, the length of the blast wave can be approximated by:
Lw ≈ U td
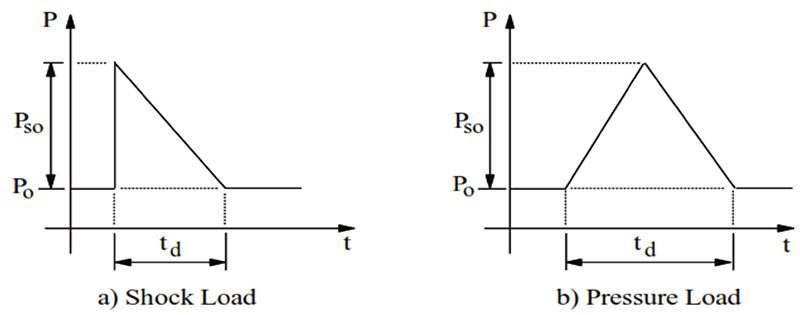
Idealized Blast Wave Parameters
To simplify the blast-resistant design procedure, the generalized blast wave profiles shown in Figure 1 normally are idealized or linearized, as illustrated in Figure 2 for a shock wave and pressure wave.
Determination of Vapor Cloud Design Overpressures
Because there are no codes or industry standards for determining what blast overpressures should be used, the design blast loads normally are supplied by the facility owner. The facility owner can perform a blast risk assessment of the targeted buildings to determine the blast pressure. Blast risk assessment of buildings can be done by a specialized consultant.
The actual design overpressures may be stated to the design engineer in two ways:
- The simplest is a set blanket statement such as; “All buildings shall be designed for a peak reflected overpressure of X psi (kPa), a peak side-on overpressure of Y psi (kPa), and duration of Z milliseconds.”
- Specifying overpressures and durations based on the distance between the structure and a potential source. The building engineer would then determine design loads based on the appropriate distance.
Commonly used criteria include SG-22 (withdrawn) and CIA (being revised). Both documents specify at least two blast overpressures for buildings spaced 100 feet (30 meters) from a vapor cloud explosion hazard as follows:
- High pressure, short duration, triangular shock loading: Side-on overpressure of 10 psi (69 kPa) with a duration of 20 milliseconds.
- Low pressure, long duration, triangular loading: Side-on overpressure of 3 psi (21 Pa) with a duration of 100 milliseconds.
Building Blast Loading
To design a blast-resistant building, the design engineer first needs to determine the loads on the building as a whole and on each structural component such as a wall, roof, frame, etc. Depending on its distance and orientation relative to the blast source, the building, and its components, will experience various combinations of blast effects (reflected overpressure, side-on overpressure, dynamic pressure, and negative pressure). The design engineer can determine the blast loads for the various building components, as illustrated below.
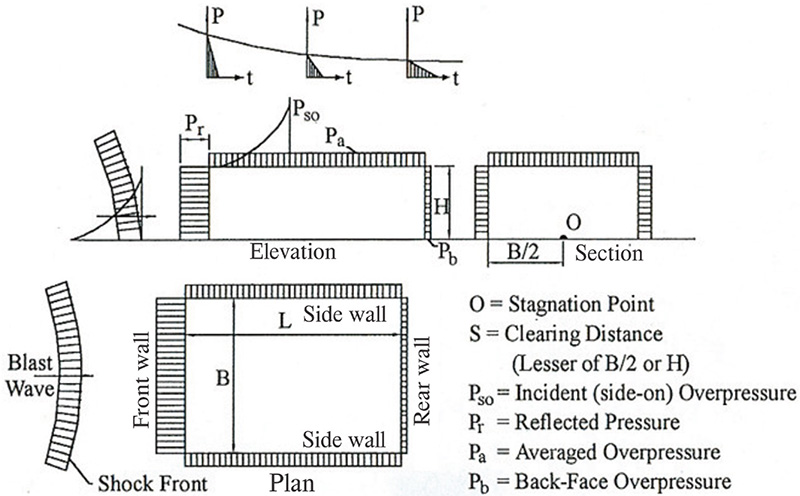
As Figure 3 indicates, triangular blast loading on the roof starts with a high pressure (P) and short duration (t) at the edge of roof facing the explosion source and gradually changes to lower pressures and longer durations from the middle to the far end of the roof.
An example of blast loads calculation is provided at the end of the article for a better understanding and demonstration of blast loads computations.
Front Wall Loading
The walls facing the explosion source will experience a reflected overpressure. The magnitude of the reflected pressure, Pr, is determined as an amplifying ratio of the incident pressure:
Pr = Cr Pso here, Cr = reflection coefficient
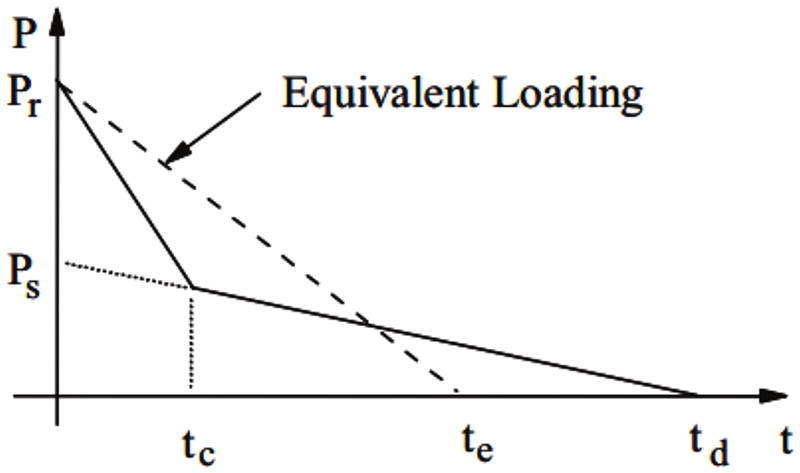
The reflected overpressure decays to the stagnation pressure, Ps, in the clearing time, tc, as defined below and illustrated in Figure 4.
Ps = Pso + Cd qo
tc = 3 S / U < td
Where,
S = clearing distance, the smaller of BH, or BW/2
BH = building height
BW = building width
As indicated in the tc equation, the duration of the reflected overpressure effect, tc, should not exceed that of the free field positive overpressure, td.
In order to use the dynamic response charts based on a triangular-shaped load, the bilinear pressure-time curve shown in Figure 4 can be simplified to an equivalent triangle. This equivalent load is computed by equating the impulse for each load shape and using the same peak pressure, Pr. The impulse, Iw, under the bilinear pressure-time curve, is:
Iw = 0.5 (Pr − Ps) tc + 0.5 Ps td
The duration, te, of the equivalent triangle is determined from the following equation:
te = 2 Iw / Pr = (td − tc) Ps / Pr + tc
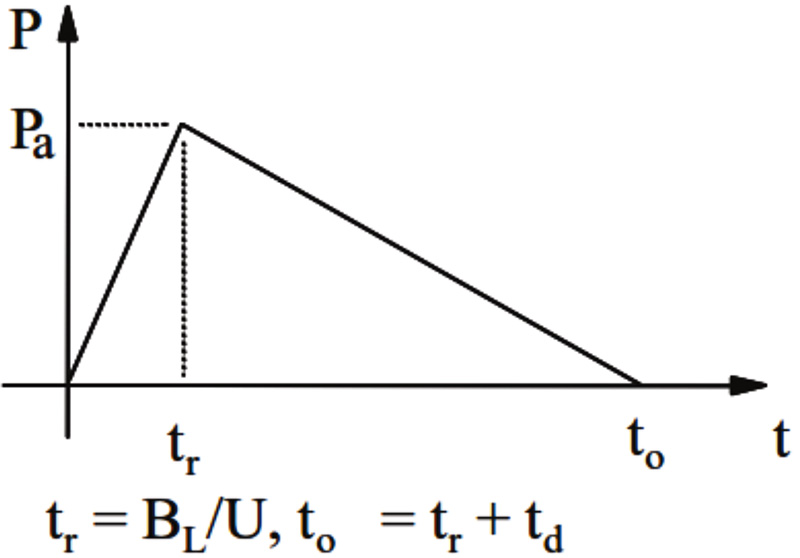
Side Wall and Roof Loading
The side walls are defined relative to the explosion source, as shown in Figure 3. These walls will experience less blast loading than the front wall due to a lack of overpressure reflection and attenuation of the blast wave with distance from the explosion source. The general form of roof and side wall blast loading is shown in Figure 5.
tr: Rise Time Duration
td: Positive Phase Duration
to: Total Positive Phase Duration
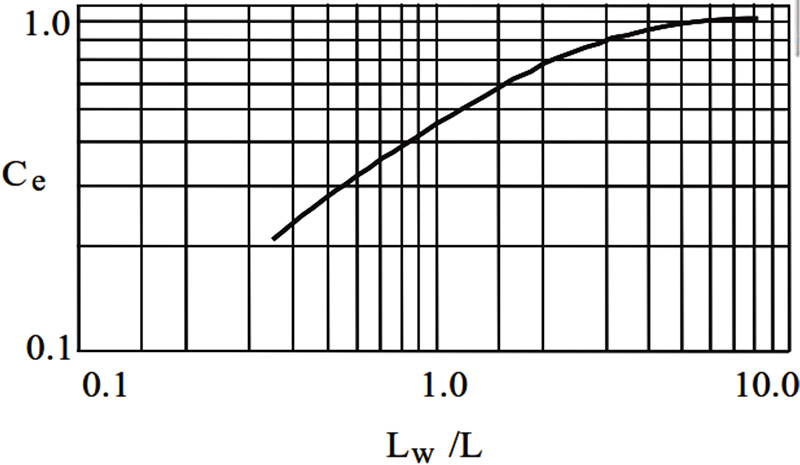
As a blast wave travels along the length of a structural element, the peak side-on overpressure will not be applied uniformly. It varies with both time and distance. A reduction factor, Ce, accounts for this effect in the design. Values for Ce (refer to Figure 6) depend on the length of the structural element, L, in the direction of the traveling blast wave, Lw. If the blast wave is traveling perpendicular to the span, then L should equal a nominal unit width of the element. The equation for side walls is as follows:
Pa = Ce Pso + Cd qo here Pa = effective side-on overpressure
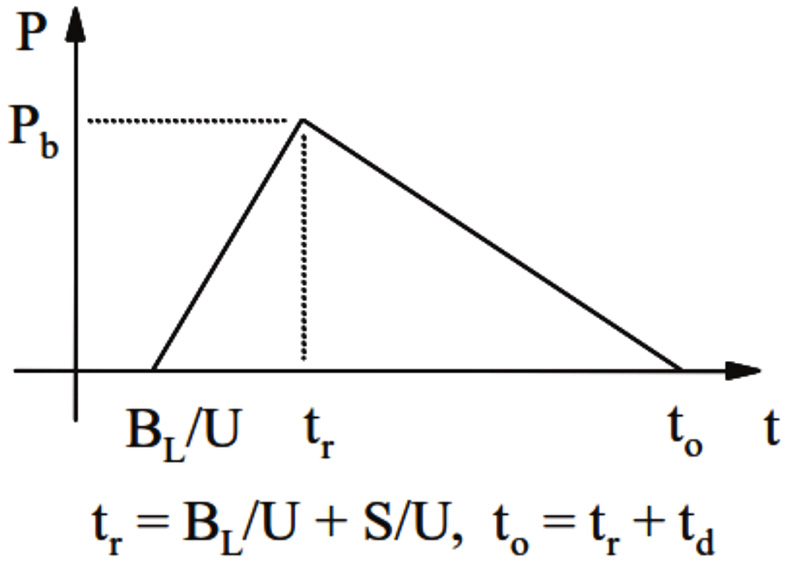
Rear Wall Loading
Rear wall loading normally is used only to determine the net overall frame loading. Because the rear wall load is opposite to the front wall load, its inclusion tends to reduce the overall lateral blast force. For buildings where a blast load occurs from any direction, rear wall effects normally are neglected conservatively. The shape of the rear wall loading is similar to that of side and roof loads.
The effective peak overpressure is similar to that for side walls and is calculated using the equation shown below (Pb normally is used to designate the rear wall peak overpressure instead of Pa). The equation for rear walls is as follows:
Pb = Ce Pso + Cd qo here Pb = Rear Wall Peak Overpressure
Blast loading Calculations Example
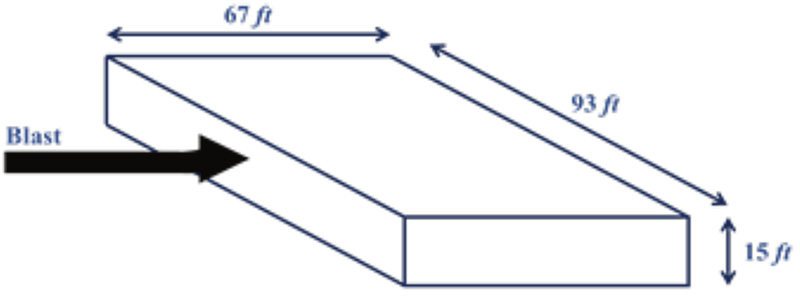
This example illustrates the calculation of blast loading on the components of a building subjected to a shock wave traveling horizontally. The building dimensions are as follows:
Width, BW = 93 feet (ft) (28.4 meters (m))
Length, BL = 67 ft (20.4 m)
Height, BH = 15 ft (4.5 m)
Blast Loading Parameters
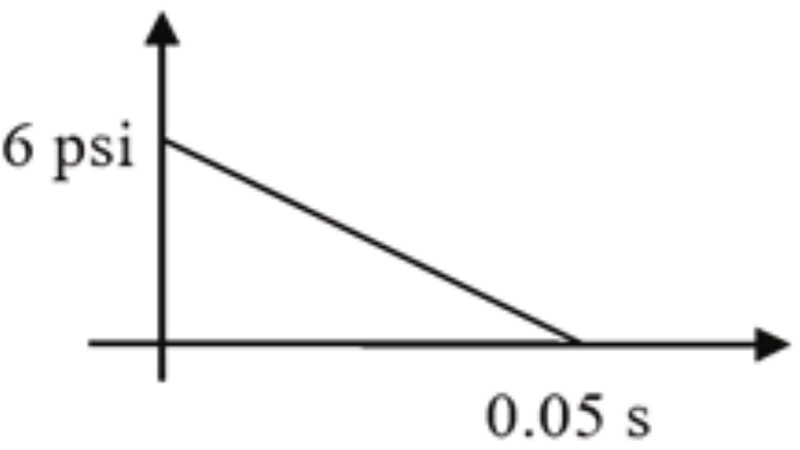
Peak side-on overpressure, Pso = 6 psi (41 kPa)
duration, td = 0.05 s
Shock Front Velocity
U = 1130 (1 + 0.058 Pso)0.5
U = 1130 [1 + 0.058 (6 psi)]0.5
U = 1,312 ft/s (400 m/s)
Length of Pressure Wave
Lw = U (td)
Lw = (1,312 ft/s) (0.05 s)
Lw = 66 ft (20.1 m)
Peak Dynamic Wind Pressure
qo = 0.022 (Pso)2
qo = 0.022 (6 psi)2
qo = 0.8 psi (6 kilo pascals (kPa))
Front Wall Loading
The front wall is assumed to span vertically from the foundation to the roof.
The design will be for a typical wall segment one foot wide.
Reflected Overpressure
Pr = [2 + 0.05 (Pso)] Pso
Pr = [2 + 0.05 (6 psi)] (6 psi)
Pr = 13.8 psi (95 kPa)
Clearing distance
S = minimum of BH or BW/2
S = 15 ft (4.5 m)
Reflected Overpressure Clearing Time
tc = [3 (S / U) < td
tc = 3 (15 ft) / (1,312 ft/s) < 0.05 s
tc = 0.034 s
Drag coefficient, Cd = 1.0
Stagnation Pressure
Ps = Pso + Cd (qo)
Ps = (6 psi) + (1.0) (0.8 psi)
Ps = 6.8 psi (47 kPa)
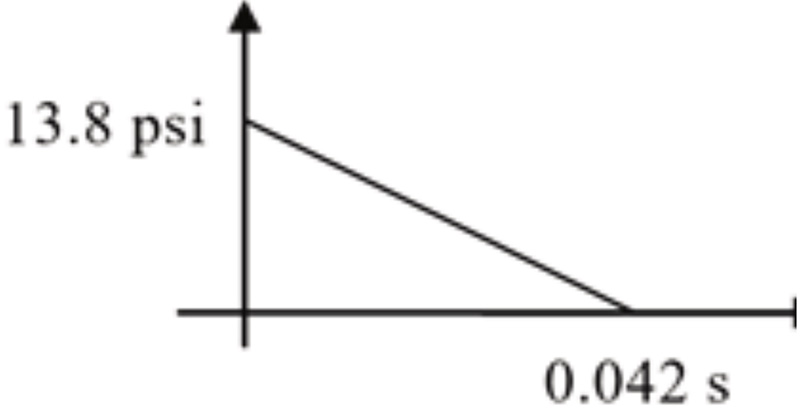
Front Wall Impulse
Iw = 0.5 (Pr − Ps)tc + 0.5 Ps td
Iw = 0.5 [(13.8 psi) – (6.8 psi)] (0.034 s) + 0.5 (6.8 psi) (0.05 s)
Iw = 0.289 psi-s (2 kPa-s)
Effective Duration
te = 2 Iw / Pr
te = 2 (0.289 psi-s) / (13.8 psi)
te = 0.042 s
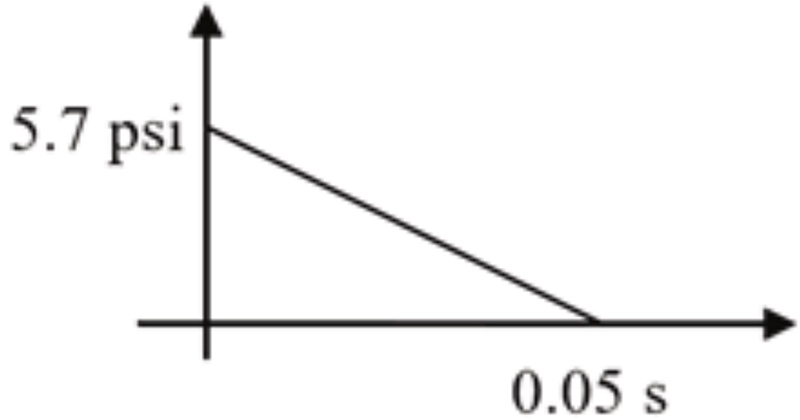
Side Wall Loading
This calculation will be for a wall segment, L1, 1 foot wide (0.3 m).
Drag coefficient, Cd = −0.4
Equivalent Load Coefficient
Lw/L1 = (66 ft) / (1 ft)
Lw/L1 = 66
Ce = essentially 1.0
Equivalent Peak Overpressure
Pa = Ce Pso + Cd qo
Pa = (1.0) (6 psi) + (−0.4) (0.8 psi)
Pa = 5.7 psi (39 kPa)
Rise Time
tr = L1 / U
tr = (1 ft) / (1,312 ft/s)
tr = essentially 0.0 s
duration, td = 0.05 s
Roof Loading
The roof is a slab spanning between roof beams of 8 feet length. For the design of the roof, a section 1 foot wide by 8 feet long will be used.
L1 = 8.0 ft (2.4 m)
Drag coefficient, Cd = −0.4
Equivalent Peak Overpressure
Lw/ L1 = (66 ft) / (8 ft)
Lw/ L1 = 8.25
therefore Ce = 0.9
Equivalent Peak Overpressure
Pa = Ce Pso + Cd qo
Pa = (0.9) (6 psi) + (−0.4) (0.8 psi)
Pa = 5.1 psi (35 kPa)
Rise Time
tr = L1 / U
tr = (8 ft) / (1,312 ft/s)
tr = 0.006 s
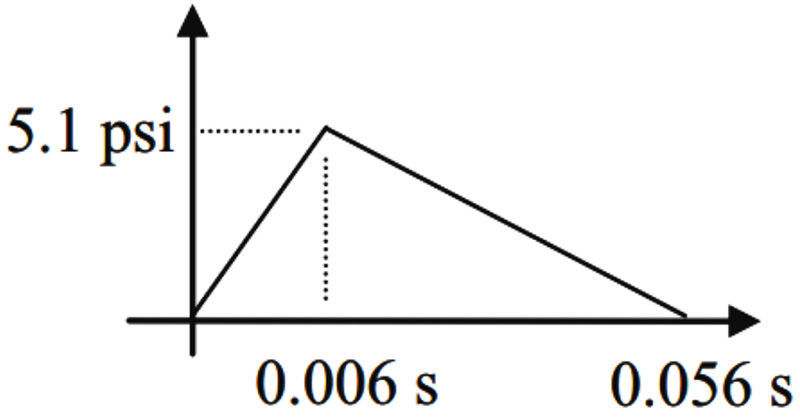
Total Positive Phase Duration
to = tr + td
to = (0.006 s) + (0.05 s)
to = 0.056 s
Conclusion
Obtaining a basic knowledge of blast loading and their respective forces is an essential step in the design of blast-resistant buildings. Blast pressures are computed as uniform pressures on building front walls, side walls, roof, and rear walls. These blast pressures can be resisted by the building’s lateral resistance systems, i.e., by shear walls, framing systems or both. The pressure on walls and roofs can be transferred to the lateral resistance system by either the tributary or dynamic reaction methods.■