
It is impossible to predict precisely the damage a building will experience in a future earthquake, because each earthquake is unique, and building simulations only model approximate responses to shaking. Losses due to earthquakes are even more unpredictable because they depend on the post-eartahquake actions of individual owners, insurers, design professionals, building officials, and contractors. Nevertheless, property investors need to understand the risk associated with property investments. Seismic risk assessment reports have become standard practice in financial due diligence.
Building owners, investors, lenders, and insurers use Probable Maximum Loss (PML), Scenario Expected Loss (SEL), and Scenario Upper Loss (SUL) as convenient means of characterizing earthquake risk for buildings. Financial decisions, including whether to purchase, finance, or insure buildings and under what terms, are often made based on the assessed PML/SEL/SUL values. However, only some decision-makers understand what these values represent, how they are derived, and the wide variation in validity of values obtained using different methods.
Historic Development
Today’s SEL/SUL parameters evolved from the Maximum Foreseeable Loss (MFL) parameter developed by the fire insurance industry. MFL represented the likely maximum repair cost for a building for a worst-case fire. Insurers reasoned that MFL was not useful for earthquakes, fearing that worst-case loss for a worst-case earthquake for any building would be 100%. Instead, the industry adopted PML, defined by K. V. Steinbrugge as “the expected maximum percentage monetary loss which will not be exceeded for 9 out of 10 buildings in a given earthquake building class, when subjected to vibratory shaking from a maximum probable earthquake.” PML is applied to buildings on firm soils, not subject to landslide or direct fault rupture, located within a 30-mile-wide strip centered on and along the length of the causative earthquake fault.
Steinbrugge suggested that in a great earthquake, a few risks will exceed the PML; a greater number will be at or near the PML, but the majority will be less than the PML. He attributed this variation to differences in shaking intensities within the zone, building configuration, construction quality, and condition. Steinbrugge presented suggested PML values for buildings of different classes, with modification factors associated with shaking intensity, soil type, location relative to the fault trace, and other factors based on his personal observations and insurance industry data.
In the 1980s, commercial property lenders concerned about earthquake risks in California began to require PML reports as a pre-condition for loan approval. The industry adopted a modified definition of PML as the 90th percentile building repair cost as a fraction of building replacement cost resulting from 475-year earthquake shaking. The PML did not include loss of use, soft costs, such as design and permitting fees, damage associated with tenant furnishings and contents, or post-earthquake fire. The 475-year earthquake was selected for compatibility with 1980s-era building code requirements. Lenders would generally offer loans on buildings with PMLs of 20% or less. The 20% level was thought to represent a repair cost that most owners would undertake rather than abandoning the property.
Soon lenders found these criteria too limiting, leaving few buildings eligible for loans. So, they revised their criteria by accepting mean, rather than 90th percentile estimates, and sometimes by specifying PML for more frequent, less intense earthquakes. Ultimately, the mean loss estimate became known as Scenario Expected Loss (SEL), while the 90th percentile loss became known as the Scenario Upper Loss (SUL).
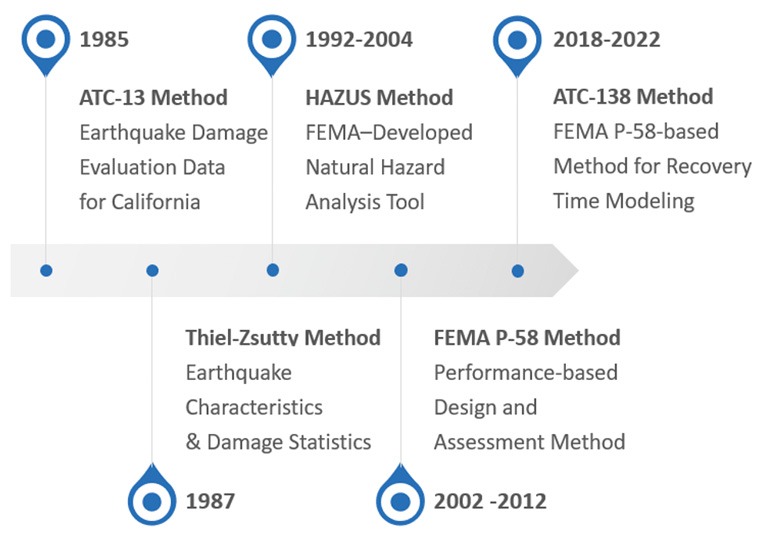
In the late 1990s, the American Society for Testing and Materials (ASTM) published standards for producing PML reports. ASTM E2557 and ASTM E2026 set criteria for the level of evaluation performed, evaluator qualifications, and standard terminology but do not specify how to estimate the loss. Evaluators currently use many methods, including the public domain models shown in Figure 1 or proprietary models such as ST-Risk, SeismiCat, and the SP3-RiskModel to predict loss.
ATC-13 Method
In 1985, the Applied Technology Council, supported by the Federal Emergency Management Agency (FEMA), published ATC-13 Earthquake Damage Evaluation Data for California. This publication intended to provide government planners with a tool to assess potential regional losses following a major earthquake. However, it is used by some PML providers today for individual building evaluations and forms the basis of some proprietary methods.
The ATC-13 report identifies building class archetypes, e.g. wood light-frame, low-rise masonry shear wall, etc. The report presents a damage loss matrix for each archetype indicating earthquake damage repair cost ratio as a function of ground shaking intensity using the Modified Mercalli Intensity (MMI) scale and probability of exceedance. This methodology has no direct way to account for individual building characteristics that could lead to increased or decreased vulnerability of a particular building relative to the archetype model. Engineers using this method must exercise individual judgment to account for building-specific vulnerabilities, such as soft stories or torsional configuration.
Unlike Steinbrugge’s tables, the ATC-13 loss matrices represent the statistical distribution of expert opinion on probable losses rather than the actual losses experienced by such buildings. The report, published in 1985, does not account for building vulnerabilities discovered in later earthquakes (e.g., the vulnerability of welded steel moment frame connections to brittle fracture). The ATC-13 judgment-based tables also do not reflect building design improvements made in the last 40 years, such as enhanced building code provisions and new structural systems. Furthermore, the MMI scale used in the methodology to characterize the strength of earthquake shaking is a dated and imprecise measure of ground motion.
Thiel-Zsutty (TZ) Method
In 1987, Charles C. Thiel Jr. and Theodore Zsutty published the TZ Method. The TZ Method depends on parameters representing the building’s structural system, similarity of the site and building periods, the site materials, and the site’s acceleration. The TZ Method utilizes the ATC-13 building class archetypes. Engineers using the TZ methodology will typically use engineering judgment to adjust values obtained from the defined building system parameters to account for building-specific characteristics.
In 2016, Thiel and Zsutty reformulated the distribution function and extended the TZ Method to reconcile the TZ and ATC-13 methods. While the TZ Method is widely used in due diligence assessment, the methodology needs to reflect the many advancements made in our understanding of building seismic performance over the last 35 years.
HAZUS Method
FEMA sponsored the Hazus project to develop guidelines and procedures for estimating regional (not building-specific) earthquake loss. An Advanced Engineering Building Module (AEBM) is available for individual buildings based on simplified single-degree-of-freedom analyses. Due to these limitations, Hazus is not typically used for seismic due diligence of individual buildings.
FEMA P-58 Methodology for Building-Specific Seismic Risk Assessment
FEMA P-58 was developed by the Applied Technology Council (ATC) under Federal Emergency Management Agency (FEMA) funding to address the insufficiencies of the existing seismic risk assessment methods. Development involved over a hundred researchers and industry professionals; this new method incorporates earthquake engineering research and computational advancements, applying statistically rigorous methods to characterize loss and has been calibrated against loss data from the 1994 Northridge earthquake. Development was completed in 2012, with some extensions and refinements published in 2018.
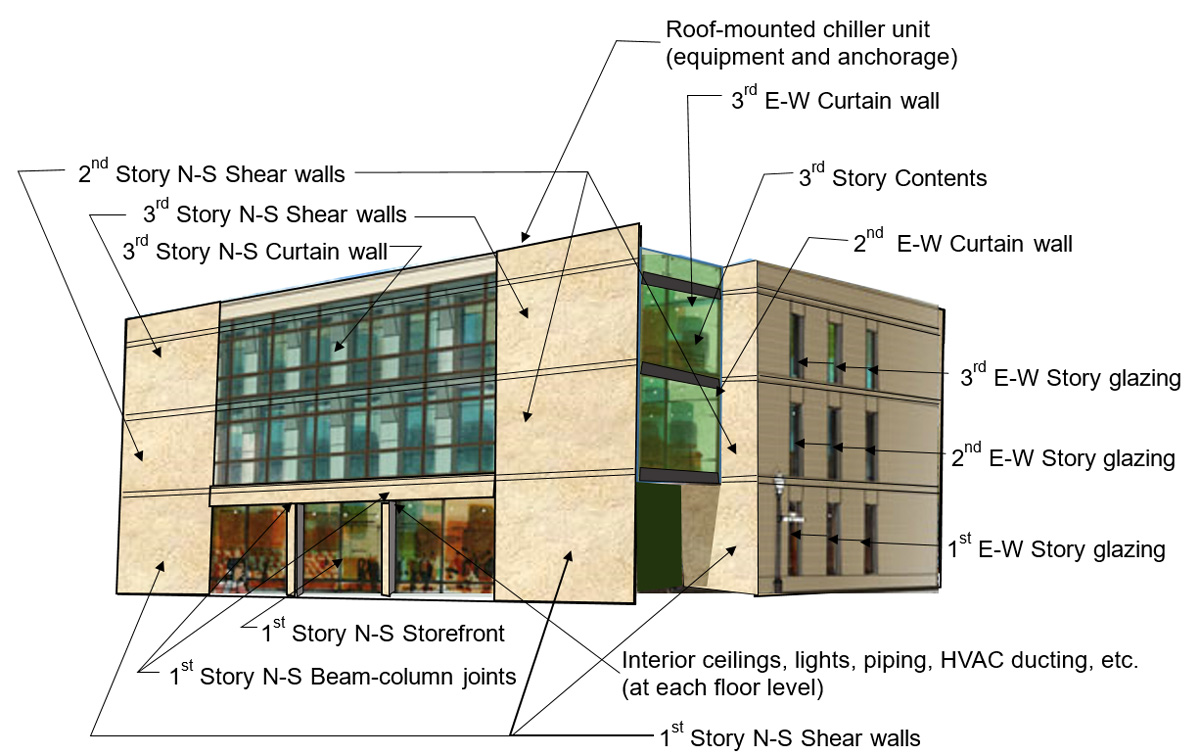
The FEMA P-58 Method can be used for the performance-based design of new buildings, retrofit of existing buildings, and for building-specific seismic risk assessments. The method starts with a building performance model (Figure 2), which defines all damageable structural and non-structural building components. A fragility function database of nearly 1,000 components quantifies the damageability of each component based on experimental data and research studies. The use of building-specific, component-level damage estimation enables better risk assessment of individual assets and more informed design decisions. The method uses Monte Carlo simulation and provides building-specific estimates of both mean losses (SEL) and 90th percentile losses (SUL). The method also predicts building recovery times including time to re-occupancy, time to regain building function, time to full repair, and red tagging probability.
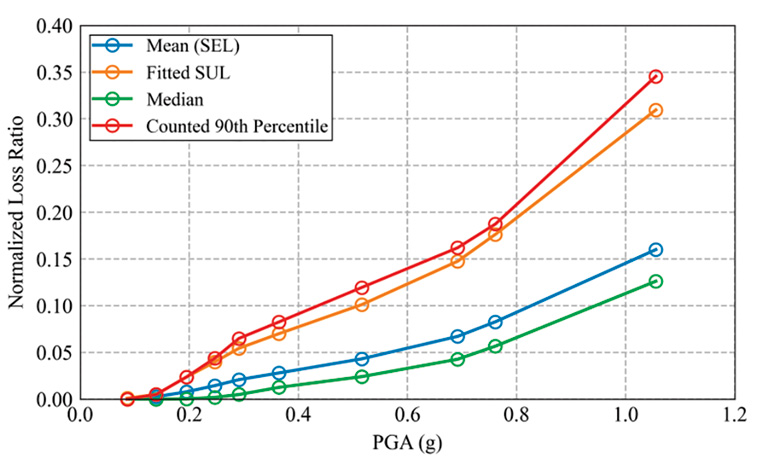
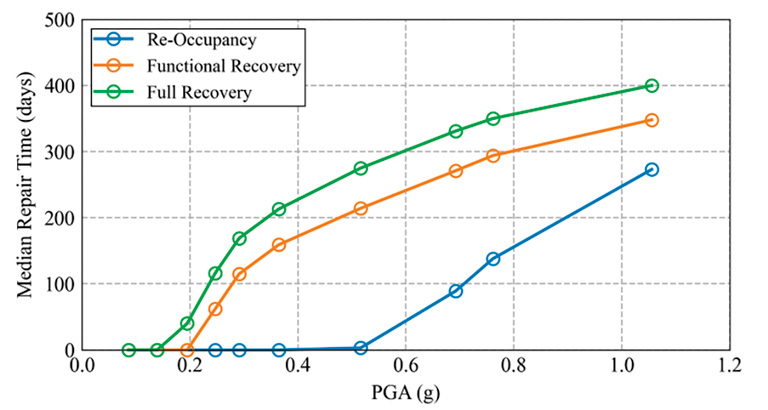
Figure 3 provides some examples of FEMA P-58 output data for a well-performing 5-story concrete shear wall building in Los Angeles. For this site, the 10% in 50 year peak ground acceleration (PGA) is 0.52g and the Maximum Considered Earthquake (MCE) motion is 1.06g.
Selecting a Method to use for Seismic
Due-Diligence Studies
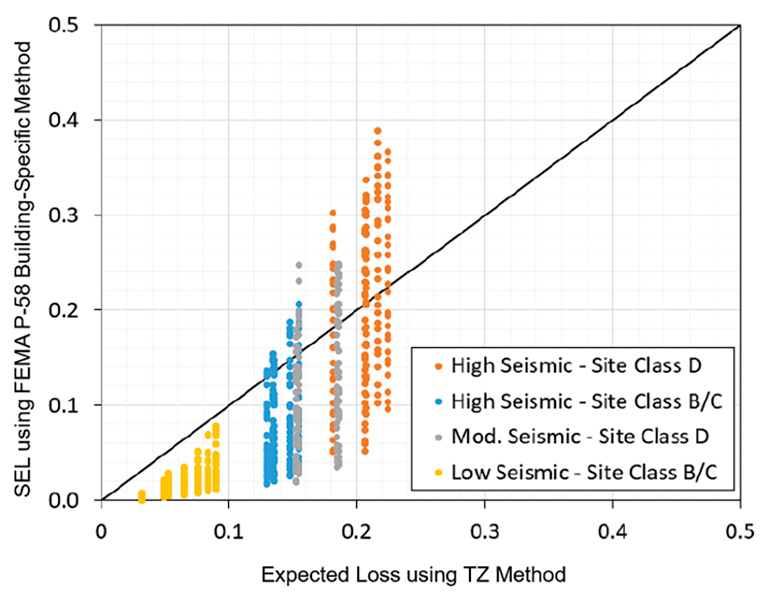
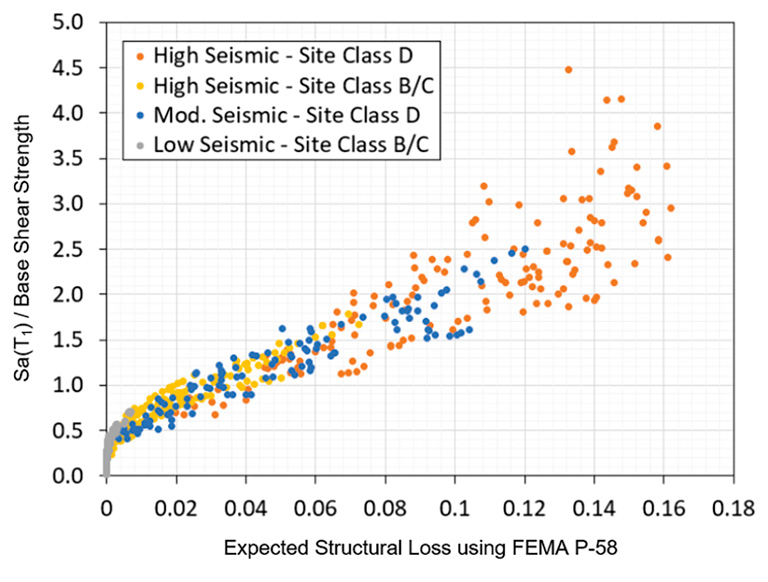
PML providers considering selecting a methodology should understand how the results between methods compare. The authors performed a comparison study between FEMA P-58 and historical methods for approximately 2,000 sample buildings. Figure 4a shows some sample results of this study for Pre-Northridge steel frames, comparing FEMA P-58 and TZ results. This study found that, on average, FEMA P-58 repair costs are similar to those of historical methods for high-seismic sites and are consistently lower for lower-seismic sites. However, the results for individual buildings vary widely, because FEMA P-58’s performance model includes more building-specific and site-specific detail. Figure 4b shows how the more accurate FEMA P-58 building-specific losses are partly explained by the use of Sa(T1) as a better ground motion intensity measure, and use of a calculated site-specific base shear strength in the building performance model.
Summary and Recommendations
Historic loss estimation methods were all developed to assess the risk for classes of buildings instead of individual buildings. These class-based methods rely on judgment to reflect individual building characteristics. This approach creates two main problems – (a) PML loss ratios are based on “average” buildings and are not very building-specific (even after judgment is added to change the results), and (b) PML results are not consistent and repeatable across providers.
The FEMA P-58 analysis method was created to provide building-specific seismic risk analysis for repair cost and recovery times and eliminates the inaccuracy associated with building class-based models. Because it is grounded in engineering analysis rather than primarily being based on judgment, FEMA P-58 results are consistent and repeatable across providers.
The FEMA P-58 analysis method was introduced in 2012, and commercial use of the method started in 2014. The method now covers all common building types and heights. The results have been validated through comparisons to earthquake data and other historical methods and have been used and vetted within the structural engineering profession for the past decade. As of 2023, no better building-specific seismic risk assessment method is available. Moving from the class-based methods of the 1980s to the current building-specific FEMA P-58 Method will enable commercial lenders, investors, insurers, owners, and other stakeholders to make more informed decisions regarding resiliency and risk.■