
Part 2
This is Part 2 of a two-part series. Part 1 (STRUCTURE, September 2021) summarized two methods, including equations for finding available strengths for aluminum based on tests. It also includes plots of calculated safety factors for various conditions. Part 2 compares results from these methods. Please note that Figure numbering continues from Part 1.
This second part continues the exploration of Methods 1 and 2 in the 2020 edition of the Specification for Aluminum Structures (Appendix 1; section 1.3) for determining available strengths based on testing.
Comparison of Method 1 and 2 Results
Refer to Figures 6 through 9 for plots of the ratio of allowable strengths (ASD) from Method 1 to corresponding values from Method 2 for the sets of variables considered. The same legend (Figure 9) for coefficients of variation applies to each plot. Quantities include:
- RTM: average (mean) test load
- R1Ω: Method 1 allowable load
- K: statistical coefficient
- CV: coefficient of variation
- Ω: Method 1 safety factor, from the Specification
- R2SF: Method 2 allowable load
- m1 = R1Ω / RTM = (1–KCV) / Ω: for Method 1 (see Equation 2 in Part 1), as used for plots.
- m2* = R2SF / RTM = 1/ SF2*: for Method 2 (refer to Equation 7 in Part 1). Here the asterisk indicates that the larger of the calculated safety factor (SF2) and the minimum safety factor (the applicable Ω in the Specification) is used.
Each plotted point corresponds to the ratio m1 / m2*. Each plotted line (“curve”) represents a value of CV , which ranges from 4% to 20%. The smallest CV is the top line in each figure. The number of samples (N) extends from 7 to 50.
The target reliability indices, βo (equal to 2.5, 3.0, and 3.5) used in Method 2, correspond to failure probabilities for a 50-year load recurrence of 0.621%, 0.135%, and 0.023%, respectively. Values of βo are given at the top of each figure. For those cases where the Method 1 available load is less than that of Method 2, the failure probability is also less.
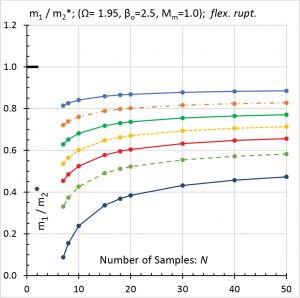
As an example (Figure 6: beam rupture), for a set of test specimens with CV = 12%, N = 18, and K = 3.370, the non-dimensional ratios m1 and m2 * are equal to 0.305 and 0.513, respectively. Thus, the allowable strength for Method 1 is 30.5% of the test average, and for Method 2, it is 51.3% of the test average. Therefore, m1 / m2* = 0.596, which indicates that R1Ω (the Method 1 allowable strength) is 59.6% of R2SF (the Method 2 allowable strength).
For Method 1 (Equation 2), note that if KCV > 1.0, R1Ω would be negative and thus not a physically usable value. For such a KCV value, no R1Ω meets the criteria of 99% exceedance with 95% confidence. As an illustration, consider CV = 0.20, N = 6 and K = 5.062, for which KCV = 1.012. This is a limitation on Method 1’s range of applicability. Method 2 does not have this limitation, but it requires a minimum N of 4 versus Method 1’s minimum of 3. Also, Method 2 calls for three additional tests if any test value deviates from the average by more than 10%.
Ranges of Ratio m1 / m2*
For ASD (Figures 6 through 9), the ranges of the ratio (m1 / m2*) of Method 1 allowable strengths to the corresponding Method 2 values are, to the nearest percentage point:
- Figure 6 (flexural rupture): from 9% to 89%.
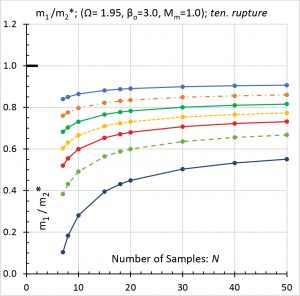
- Figure 7 (tensile rupture): from 10% to 91%.
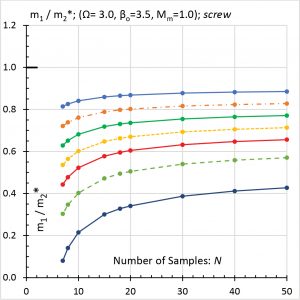
- Figure 8 (tapping screw connections): from 8% to 89%.
- Figure 9 (welded connections): from 14% to 117%, which is the largest range.
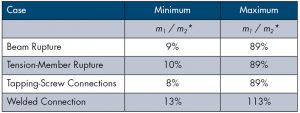
For LRFD (not plotted), the ranges of the ratio m1 / m2* to the nearest percentage point are given in the Table. All individual LRFD ratios are less than or equal to and within a few percentage points of the corresponding ASD ratios. (The largest difference is 3.9%, for welded connections at N = 50 and CV = 4%.)
Overall Trends
Figures 6 to 8 pertain, respectively, to the limit states of flexural rupture, tensile rupture, and the various failure modes (e.g., fastener tension, pull-out, pull-over, shear, etc.) for connections utilizing tapping screws.
- For these three figures, Method 1 allowable strengths more closely approach the corresponding Method 2 strengths when there is a combination of relatively low CV and large N.
- As the number of samples (N) increases while CV is held constant, Method 1 allowable strengths tend toward those of Method 2.
- For a given N and a decrease in CV, Method 1 allowable strengths also tend toward the corresponding Method 2 strengths.
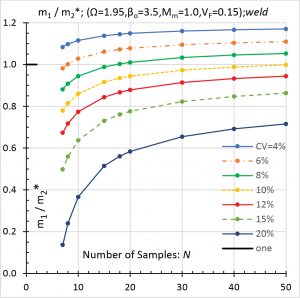
Figure 9 (welded connections) is an exception. Here, for 4% ≤ CV ≤ 8%, all of the 4% curve and most of the 6% and 8% curves exceed 1.0; i.e., the Method 1 allowable values exceed the corresponding ones from Method 2. This is partly due to the combination of a small and medium CV with a relatively large value of VF (0.15 vs. 0.05) in Method 2. Also, for these three curves at m1 / m2 * > 1.0, both a decreasing CV and an increasing N cause the Method 1 allowable strengths to be increasingly larger, on a percentage basis, than the corresponding ones of Method 2.
Small N and Large CV
For test sets consisting of a relatively small number of specimens (e.g., 7 to about 12) and which have a large coefficient of variation (e.g., 15% and 20%) for the test strengths, it is evident that the use of Method 1 entails a substantial “penalty” as compared to Method 2.
Recall that Method 1 utilizes a progressively larger factor (K; see Figure 1 in Part 1) to address the inherent uncertainty associated with small N. If CV is also large, then the combined effect on the allowable strength is quite substantial.
Consider a hypothetical case (tension member rupture; Figure 7) where initial testing includes four specimens. At least one specimen is found to have a strength that differs from the average by more than 10%. Thus, per Method 2, three more samples are tested for a total N = 7. The CV for N = 7 is determined to be 15%. For Method 2, the allowable strength R2SF = 0.406 RTM. For Method 1, the allowable strength (R1Ω) is 0.156 RTM . Therefore, the ratio m1 / m2* = 0.384; the Method 1 allowable strength is 38% of the Method 2 allowable strength. If additional specimens are tested, the test average and coefficient of variation could be similar to the values for seven specimens. If so, then the allowable strengths would increase. Try eight more specimens for a total N = 15. Here, R2SF = 0.429 RTM and R1Ω = 0.242 RTM. These results reflect a 5.6% increase in Method 2’s allowable strength and a 55% increase for Method 1. Also, Method 1 allowable strength would rise to 56% of that for Method 2 (i.e., m1 / m2* = 0.565).
Conclusion
As these comparisons have demonstrated for the cases considered, Method 1 available strengths are generally smaller (more conservative) than the corresponding ones of Method 2. However, Method 1 involves fewer input parameters and is easier to use than Method 2.
The available strength differences can be large, especially for a combination of a small number of specimens (N) and a large coefficient of variation (CV). An exception occurs for welded connections, for most or all N at CV of 4% to 8%, for which Method 1 available strengths are larger than those of Method 2. This is due to a large VF (fabrication-variation parameter) for welded connections.■