
Reconsidering Costs in Areas of Lower Seismicity
The economics of reducing seismic risk has generally received less attention in regions of lower seismicity than in higher-risk regions of the country. Though less heralded, the subject is important: what investment in risk reduction is appropriate to the extant risk?
Three relevant subtopics are explored in this article. First, the code methodology for calculating design seismic forces results in geographically variable “effective return periods” across the U.S., causing design forces in lower seismicity areas to be based on rarer events than in regions with greater seismicity. Second, FEMA’s annualized economic loss estimates demonstrate that community-wide seismic improvement generally does not “pay for itself.” Third, empirical data from the 2011 Mineral, Virginia, earthquake – which subjected a considerable inventory of pre-code and non-compliant buildings to design-level shaking – demonstrates the seismic adequacy of the “as-is” building inventory in low and low-moderate seismicity areas.
Effective Return Period
Before the International Building Code (IBC) and ASCE 7-98, Minimum Design Loads for Buildings and Other Structures, the design earthquake across the U.S. was based on a mapped probability of exceedance of 10 percent in 50 years. Newer codes and standards instead use ground motions having a probability of exceedance of 2 percent in 50 years, multiplied by a uniform scale factor of 2⁄3 to derive design accelerations (the DBE). Though the scale factor may have maintained parity for California’s seismic design forces before and after the change, the consequences stemming from the introduction of this scale factor are far-reaching. In short, the codified seismic design requirements for major cities across the U.S. now yield haphazard outcomes for the “effective” return period of the design earthquake. Therefore, while the current code articulates seismic hazard for design as a uniform return period across the U.S., the codified design process instead achieves strikingly nonuniform results in terms of effective DBE hazard. Any decision about whether to improve, or to require improvement, of a building or inventory of buildings, and about the appropriate target for that improvement, should account for this.
The authors define an “effective return period” as an effective probability of exceedance over a specific duration of time. To illustrate the concept, effective return periods for nine locations in the U.S., representing areas of low, moderate, and high seismicity, were derived.
These effective return periods were derived using hazard curves obtained from the USGS Unified Hazard Tool for each location, adjusted to obtain maximum response values. The procedure for deriving the effective return period is graphical. As illustrated in Figure 1, the hazard curve was plotted, the 2,475-year return period values (i.e., MCE event) were multiplied by 2⁄3 as required by U.S. codes, and the hazard curve was re-entered to obtain the effective return period associated with this reduced value. This operation was applied to the hazard curves for nine cities, as tabulated in Table 1. Values for both the MCE and the MCER are instructive because U.S. codes evolved from reliance on the MCE to a “risk-adjusted” MCE, referred to as the MCER, beginning with the adoption of ASCE 7-10.
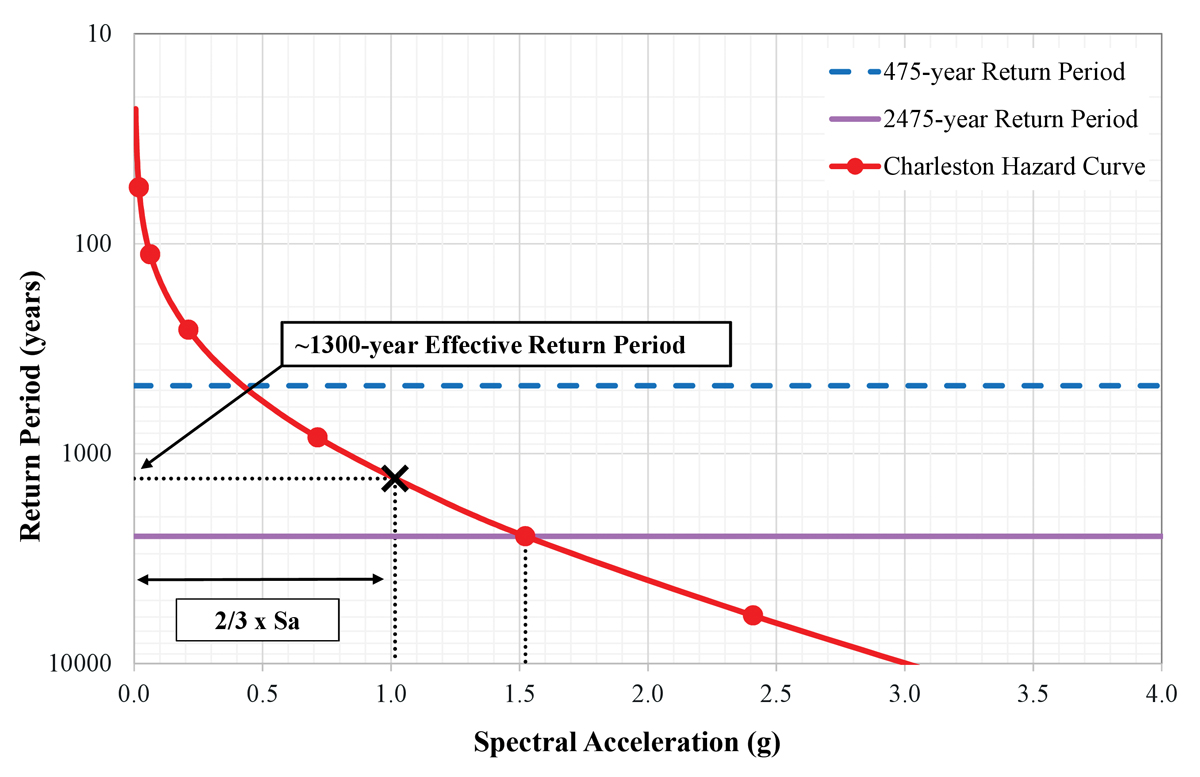
Figure 1. Example derivation of effective return period for Charleston, South Carolina.
City-to-city variability in Table 1 is striking, demonstrating that designs in lower seismicity areas have longer effective return periods than designs in higher seismicity areas. This means that areas for which seismicity ought to be of less concern are required to design for less frequent, rarer events than areas with more substantial seismic hazards. The data also illustrates that the evolution from the MCE to the MCERdid not rectify this discrepancy. The fifth column of Table 1 provides the effective return periods and probabilities of exceedance values for one-half the MCER, a level consistent with the reduced demands of the International Existing Building Code (IEBC) for certain existing structures undergoing alteration or repairs. Again, the values vary widely due to the use of a scalar multiplier on probabilistic events.
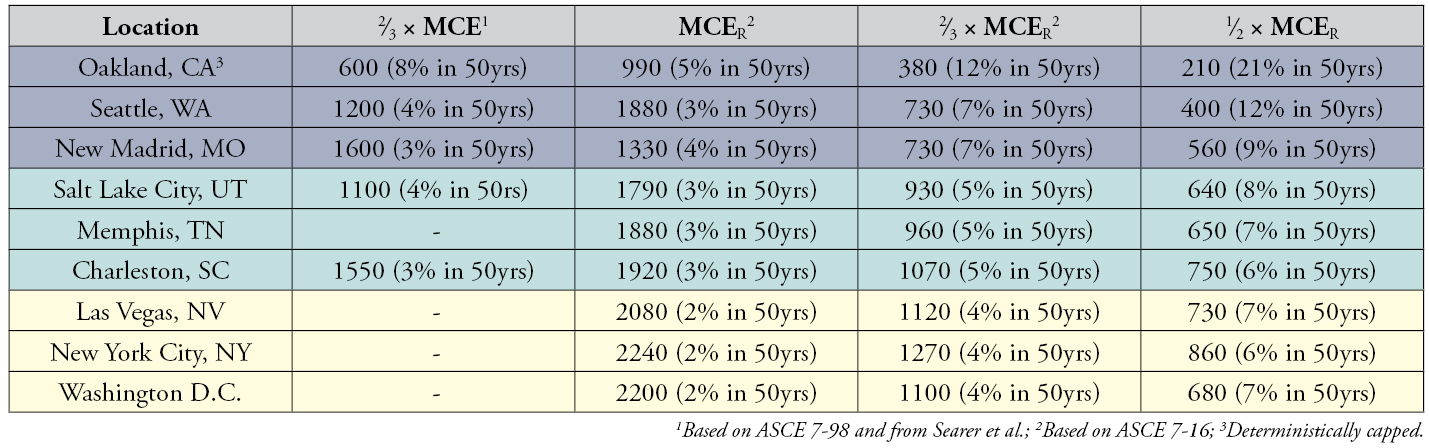
Table 1. Effective design return periods and probabilities of exceedance in 50 years.
Annualized Earthquake Loss
The U.S. Federal Emergency Management Agency (FEMA) studied the economic risks posed by earthquakes quantified via two risk indicators:
- Annualized Earthquake Loss (AEL): The estimated long-term cost of earthquake damage to the inventory of existing buildings in a specific geographic area (e.g., state or metropolitan area) on a per-year basis (i.e., annualized).
- Annualized Earthquake Loss Ratio (AELR): The AEL divided by the replacement value of the building inventory and expressed as a ratio of dollars of damage to dollars of inventory.
The top portion of Figure 2 is a FEMA-generated map of the U.S., color-coded to reflect the AELR for each state/territory. The color-coded scale used is not linear and appears biased toward smaller AELRs, which obscures the relative hazard posed in each area. To better visualize the relative risk, the authors revised FEMA’s map to reflect AELRs based on a linear color scale with five uniform increments, as shown in the bottom portion of the figure, with the lowest increment of $0 to $220/$1,000,000 representing negligible overall economic risk. The resulting map demonstrates that the vast majority of the geography of the U.S. has a negligible overall economic risk of seismic damage, with only eight states and one territory having an AELR greater than $220/$1,000,000.
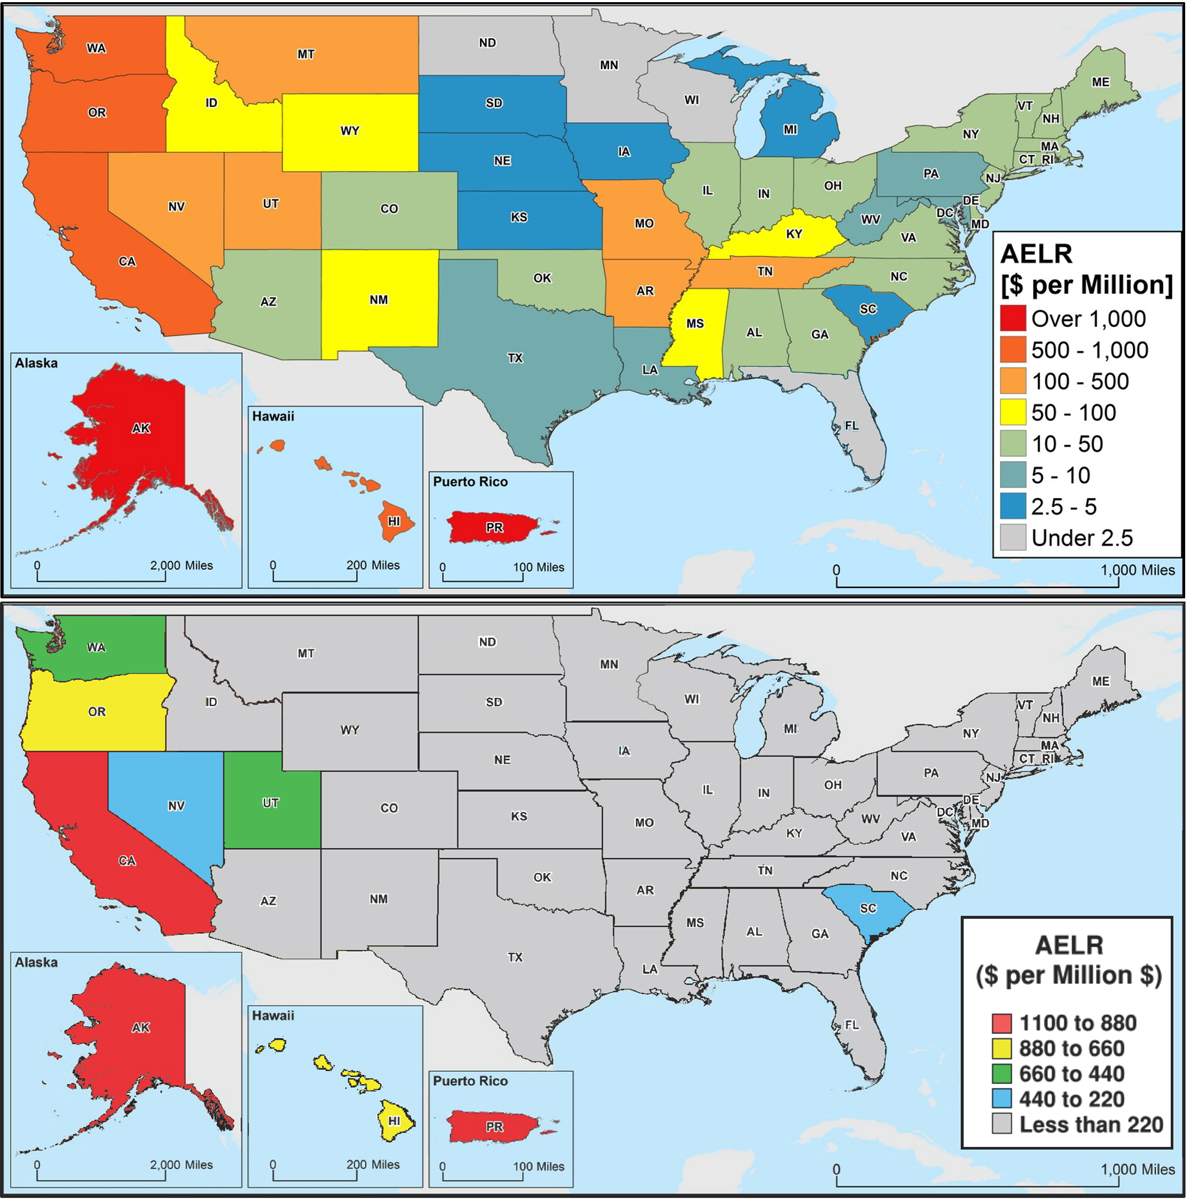
Figure 2. Annualized earthquake loss ratios by state, by FEMA (top) and recolored linearly (bottom).
AELR and Individual Buildings
Although AELR values have certain limitations, the hazards posed by earthquakes can also be visualized on a per-building basis. Using AELR values for a given metropolitan area, the authors computed the potential economic exposure for an “average” building, say an office building, with a replacement value of $20 million in the nine cities. It was assumed that an “average” existing property might have about 20 years remaining in its life until it is either demolished or undergoes a significant renovation. A cumulative loss estimate for that period was also computed by multiplying the average annualized loss by this 20-year exposure period, as shown in Table 2.
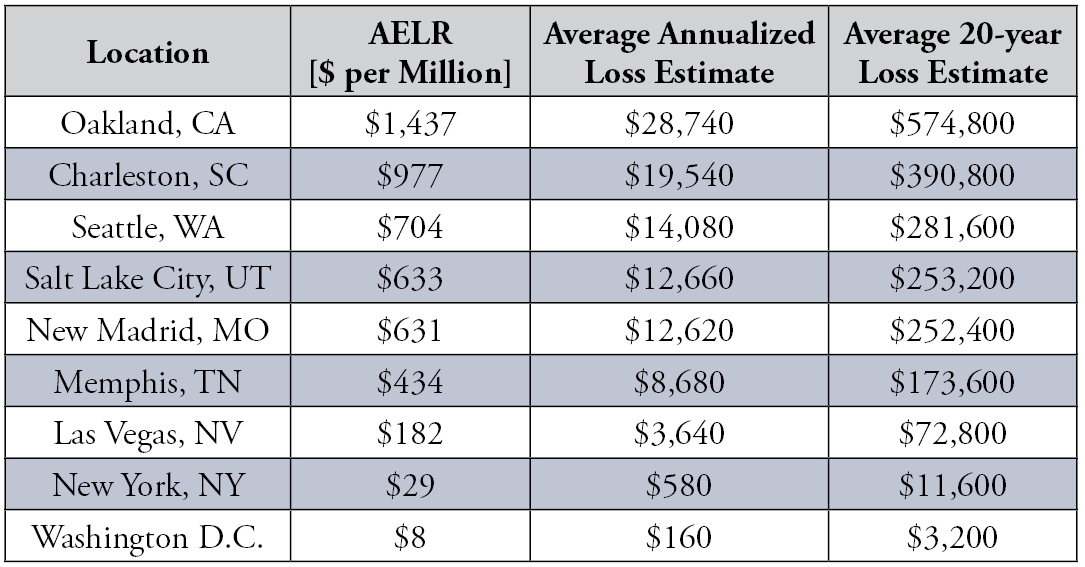
Table 2. Economic risk posed by earthquakes for nine selected cities.
In Oakland, the cumulative 20-year risk for this “average” office building is $575,000. Since strengthening this hypothetical building could easily cost several million dollars, it likely makes little economic sense to do so unless the building is very likely to perform significantly worse than an average building.
In areas of moderate seismicity like Seattle or Salt Lake City, with an average cumulative economic risk of only about $260,000 for that same $20 million office building, it would be challenging to justify seismic strengthening from a purely ‘cost of physical damage’ perspective when an upgrade is likely to cost an order of magnitude more than the cumulative loss. In these areas, perhaps focusing on strengthening only the most vulnerable parts of the most vulnerable buildings makes sense.
In areas of low seismicity like New York City and Washington D.C., with a 20-year cumulative exposure of $12,000 or less for the average $20 million office building, it appears unreasonable for seismic strengthening of such buildings to be in the discussion since most seismic strengthening activities – except perhaps strengthening only the most vulnerable parts of the most vulnerable buildings – will never come close to paying for itself.
Case Study
The above AELR data is notably at odds with the common understanding that most older buildings in areas of lower seismicity do not fare well when measured against either the seismic design requirements in the IBC or ASCE 41. However, the 2011 Mineral Earthquake (Virginia) provides a substantial data set with which to resolve the disparity. That event exposed an inventory of buildings presumably numbering in the hundreds of thousands to ground shaking that exceeded design or MCE levels. Thus, it provides ground-truth empirical data to assess the economic reasonableness of pursuing inventory-wide seismic strengthening of existing buildings in areas of lower seismicity. Much of the building inventory that was shaken most strongly was older pre-code, or at least pre-modern-code, unreinforced brick masonry construction. The building inventory was also representative of construction along the eastern seaboard for which the USGS postulates a design shaking intensity similar to what was experienced in many areas shaken by Mineral. For example, Figure 3 depicts measured and calculated ground motion spectra from various locations in and around Washington D.C. during Mineral, as well as the USGS MCER spectrum for the National Mall in Washington, roughly 130 kilometers from the Mineral epicenter. It indicates that low rise buildings – which would include the vast majority of buildings in the Washington D.C. metropolitan area – likely experienced ground shaking exceeding the DBE, in some cases by significant margins. While significant, potentially life-endangering damage occurred primarily to façade ornaments and appendages of a very limited number of unique pre-code, heritage masonry structures in Washington, D.C., little or no damage occurred to the tens of thousands of older masonry bearing wall residential and commercial buildings. Where damage was noted, it was typically limited to sporadic damage to unreinforced masonry chimneys, veneer, and parapets rather than to primary structural components. No lives were lost as a result of the earthquake, and the dollar value of the earthquake-caused damage has been estimated to total only about $200 to $300 million.
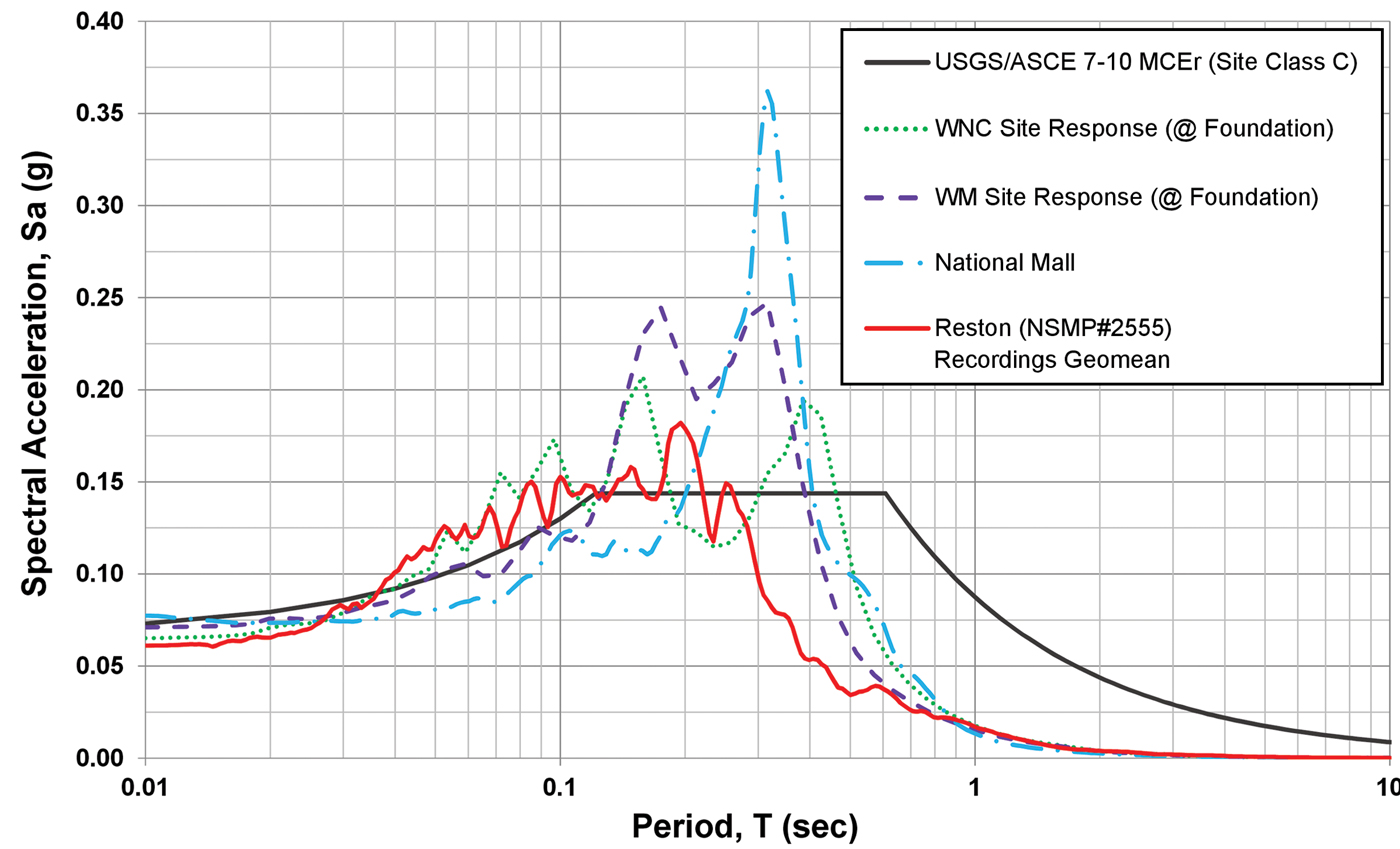
Figure 3. USGS MCER for Washington, D.C., versus recorded/computed motion. Adapted from Wells et al.
Even in the epicentral region, post-earthquake damage survey results found that heavy damage was sporadic, with up to seven houses destroyed and major damage to 120 houses. Beyond 1.8 miles (3 km) from the epicenter, the damage distribution had moderated such that, while many residences had some damage, few residences had major damage. Two buildings collapsed in the town of Mineral, with minor damage to several other buildings. No lives were lost in any of these buildings. While the significance of this damage for the individuals whose property was affected should not be downplayed, the post-earthquake survey results demonstrate that buildings in the community-at-large performed well within the intent of the code for new construction.
This empirical evidence demonstrates the dubious premise of promoting seismic improvement on a community-wide basis in the low-seismicity Washington D.C. area – at least if the economics of preventing building collapse and loss of life are the driving considerations. Moreover, given the excellent performance of the inventory of older buildings shaken by MCE-level motions during Mineral (buildings for which seismic forces were never explicitly considered during design), it is unreasonable to conclude that similar inventories of buildings in similar seismic exposures would be seismically inadequate or pose a substantial threat to occupants. If seismic strengthening has merit in these areas, it is primarily with respect to unique heritage structures. For more typical buildings, the focus should be on mitigating demonstrable risks such as unreinforced masonry chimneys, ornaments, and veneer rather than wholesale upgrading. Of course, likely collapse in an MCE or lesser event that is identified during the assessment of an individual building should be addressed. The economic arguments presented by the authors in this article apply to building inventories such as those described that have demonstrated an ability to withstand a design event or greater with minor damage.
Conclusion
Geographically-variable effective return periods that result from code-required scaling of the 2,475-year earthquake counterintuitively require design for much rarer earthquakes in lower seismicity areas than in areas of higher seismicity. Return periods should be chosen that make sense for the project rather than using a defined percentage of the requirement for new construction. Both economics and risk are necessary considerations in strengthening decisions. Understanding that FEMA’s AELRs apply to large inventories of buildings rather than to individual ones, the AELRs nevertheless indicate that earthquakes pose little to no risk of costly earthquake damage across most of the U.S. Evidence from the 2011 Mineral Earthquake supports this thesis, as relatively minor economic impacts and no loss of life were observed from DBE- and MCE-level shaking across a broad region. Engineers should focus on mitigating the collapse mechanisms in buildings for which partial or complete collapse is likely because that is where the economics of intervention makes the most sense.■
References
Searer, G.R., Freeman, S.A., and Paret, T.F., (2007) Does It Make Sense from Engineering & Economic Perspectives to Design for a 2475-Year Earthquake, Continental Intraplate Earthquakes: Science, Hazard, & Policy Issues, Boulder, CO: Geological Society of America, 2007, p. 353-361.
FEMA (Federal Emergency Management Association). (2017) Hazus® Estimated Annualized Earthquake Losses for the United States, FEMA P-366, FEMA.
Wells, D., Egan, J., Murphy, D., and Paret, T. (2015). Ground shaking and structural response of the Washington Monument during the 2011 Mineral, Virginia, earthquake. 10.1130/2015.2509(12).
Virginia Department of Mines, Minerals, and Energy (VDMME), (2011). Major Earthquake 2011 webpage obtained from www.dmme.virginia.gov/DGMR/earthquake2011.shtml, accessed on January 27, 2020.