
This article reviews the failure mechanisms of the Tacoma Narrows Bridge (TNB) on November 7, 1940, and the characteristics of the original bridge that facilitated the resultant theories on its failure. The design of the bridge pushed the boundaries of knowledge at the time, unfortunately with undesired consequences. The failure resulted in a re-evaluation of the design practice. The objective of this article is to illustrate the concept of aeroelasticity and its consequences on structural behavior through this historic failure and to evaluate its applicability to some unsuspecting structures.
Bridge Design
The Tacoma Narrows Bridge is located in the Tacoma Narrows of Puget Sound, Pierce County, Washington. Clark Eldridge’s original $11 million design ($192 million: 2017) of the bridge was modified for a more economical $6.4 million design by Leon Moissieff. Eldridge’s original design consisted of 25-foot-deep trusses that would have stiffened the deck. Experts believe the bridge might have survived the winds on November 7, had those trusses been installed (WSDOT, 2005). The original bridge was designed for 120 mph winds.
Moissieff designed a two-lane bridge with two 1100-foot side spans and a 2800-foot main span. Within these constraints, Moissieff used deflection theory, which depends on the stiffness due to the dead load of the structure to resist the deflections due to the live load. This led to the consideration that the stiffness of the proposed trusses did not contribute considerably to the stiffness of the suspended deck and led to the design of the stiffening girders for resisting lateral wind forces. Deflection theory was common for suspension bridge designs of the time. For example, bridges like the Manhattan Bridge and the Bronx-Whitestone Bridge were designed using deflection theory. The TNB design pushed the boundaries of this design philosophy as evidenced by some characteristic features (Figure 1). The width of the bridge and depth of the girders were smaller, leading to large slenderness ratios. The span/width ratio (75:1) of the TNB was 1.5x and the span/depth ratio (375:1) was more than two times that of the Golden Gate Bridge. The lighter steel resulted in a center span that is around 3.5x lighter than the Golden Gate Bridge.
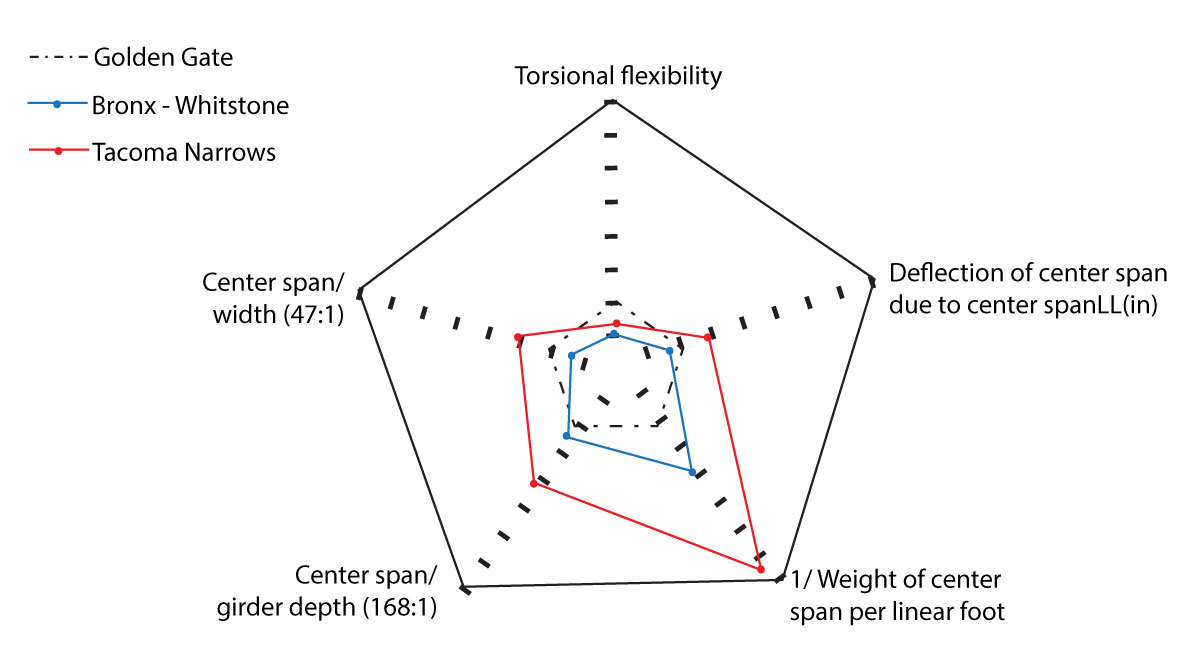
Figure 1. Characteristics of Tacoma Narrows normalized to the Golden Gate bridge, data from (Ammann, 1941).
The final superstructure consisted of built up stiffening girders spaced 39 feet on-center, 52-inch-deep plate girders as transverse floor beams at 25 feet, supporting (5) 21-inch rolled beams as longitudinal stringers at 5 feet-9 inches, which in turn supported the 5¼-inch concrete roadway. The stiffening girders were built up with a 96-inch x ½-inch web, (4) 8- x 6- x ½-inch angles and (2) 20- x ½-inch cover plates. The web was stiffened longitudinally with “zees” on one side and transversely with vertical channels on the other. Each of the 17⅛-inch diameter cables consisted of 19 strands of 332x No. 6 cold drawn galvanized wires, constructed at a sag ratio of 1/12 with (4) 1¼-inch diameter suspenders at 50 feet along each cable.
Bridge Behavior and Collapse
During construction, which commenced in November 1938, workers experienced significant vertical vibration of the deck consequently attributing to the title, “Galloping Gertie.” Professor Burt Farquharson at the University of Washington was tasked with monitoring these vibrations and studying retrofit measures. An observation of vibrations (Ammann, 1941), documented after opening the bridge to the public, reported that oscillations with amplitudes of 48 inches were observed at 16 cycles/minute at wind speeds of 3 to 4 mph. However, monitoring also revealed certain characteristics like oscillations having no effect due to wind turbulence or traffic loading. It was also reported that the bridge remained motionless on occasions in winds varying from 0 to 35 mph. Initial retrofits to reduce the vibrations included plate girders being tied down, adding 1½-inch-diameter inclined stays from cables to midspan of the stiffening girders, and the addition of hydraulic dampers. The dampers were not as effective in comparison to similar installations on other bridges, and the stay ropes slipped and were ineffective. Professor Farquharson’s recommendation of adding semicircular deflector shields to streamline the girders, based on wind tunnel model studies, was approved early November 1940 by the Washington Toll Bridge Authority.
Videographic documentation of the failure is available (https://bit.ly/2xw174p) for posterity to observe, investigate, and recreate the failure for those interested in understanding the failure mechanism. It should be noted that some inconsistencies in recording (16 fps (frames per second)) and documentation (24 fps) led to inadvertently speeding up the video, which might be inaccurate for reconstruction. The morning, on the day of failure, saw the center span oscillating with 8 to 9 nodes at frequencies of 36 to 38 cycles/min (Figure 2) while wind speeds in the range of 42 mph were recorded. At around 10 AM, the frequency changed from 37 to 14 cycles/min with torsional movement observed about a node at mid-span. This change in motion resulted in oscillations with cable amplitudes of approximately 28 feet, causing an angular twist of the superstructure of about 45 degrees at quarter points. At 11 AM, the 600-foot suspended superstructure dropped, culminating in the collapse of the remaining central span superstructure at 11:10 AM.
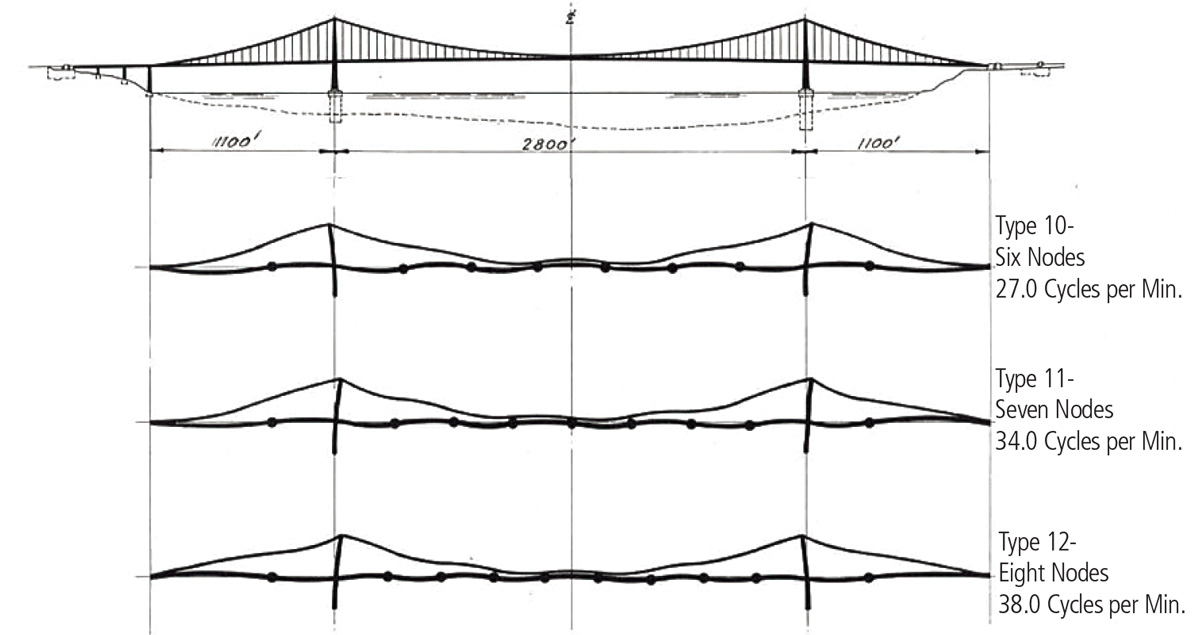
Figure 2. Observed vertical (plunge) oscillations on the Tacoma Narrows Bridge (Ammann, 1941).
Resonance and Vortex Lock-in
Early thoughts on the failure mechanism were directed towards resonance from external wind loading (NYT, 1940). Historical failures of the Broughton suspension bridge in 1831 and Angers suspension bridge in 1850 due to marching troops may have contributed to this line of thought. Federal Works Agency (FWA) report’s statement, “Its [Tacoma Narrow’s] failure resulted from excessive oscillations caused by wind action,” was not very clear and inadvertently corroborated the theory. While some attribute the periodicity required for resonance to turbulence in wind (Miller, 1977, McCormick, 1969), others attributed it to the shed Karman vortices. However, the variation in the characteristics of wind loading at the site could not account for the required periodicity for the resonance of the bridge.
Interaction of fluids with static, bluff (not streamlined) bodies results in the formation and shedding of vortices in the wake, referred to as “Karman vortex street.” Figure 3 shows the formation of the Karman street in atmospheric cloud movement due to Guadalupe Island, as seen from a weather satellite. The frequency of vortex shedding will depend on the cross-flow dimension (diameter of the island), free stream velocity, and the Strouhal constant. The calculated vortex shedding frequency for the bridge superstructure with 8-foot-deep girders, 42 mph wind, and a Strouhal constant of 0.11 would equate to 1Hz, while documented oscillations on the day varied from 0.6Hz (37 cycles/min before 10 AM) to 0.2Hz at failure (14 cycles/min). This acted as sufficient evidence to refute the theory of resonance due to synchronization with wind and Karman vortices.
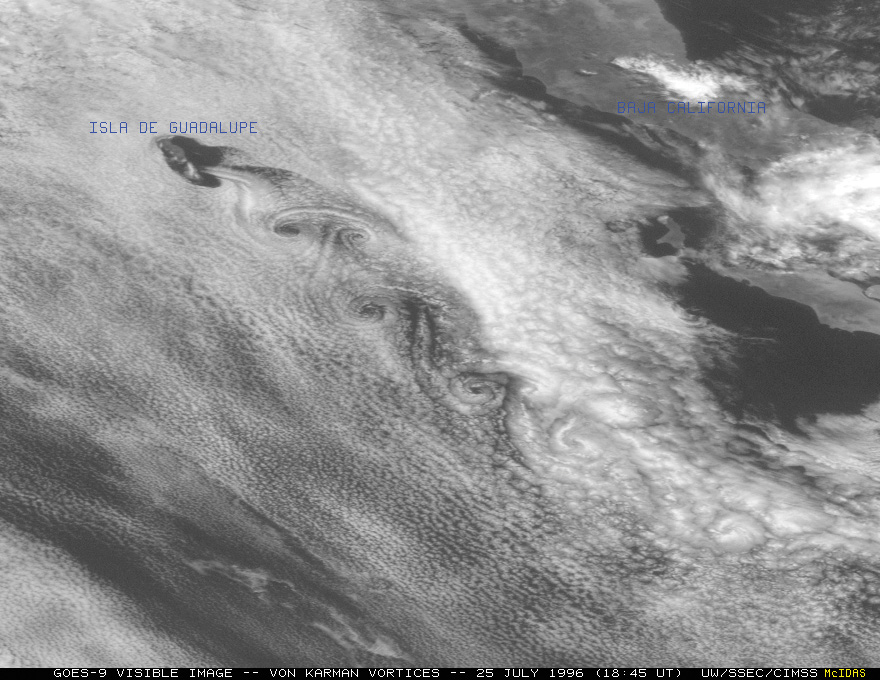
Figure 3. Karman vortex street on GOES-9 satellite observed due to Guadalupe Island (CIMSS, 2001).
This calculation also disproved the hypothesized vortex lock-in effects as being a cause of failure. Vortex lock-in may be characterized as mechanical excitation in the presence of vortices at the frequency of the structure. Lock-in vibrations are believed to be the cause of in-service vibrations observed by the bridge, but not a cause of failure (Billah, 1991). Lock-in effects typically excite the structure at its resonant frequencies; however, as the amplitude of vibrations increase, changes in boundary conditions introduce self-limiting forces resulting in Van-der-Pol type limiting oscillations. In the case of the TNB, the observed vortices are concluded to be a consequence of oscillations but not a primary cause for its failure.
Modern Consensus
The FWA report concluded: “The vertical oscillations of the Tacoma Narrows Bridge were probably induced by the turbulent character of wind action. Their amplitudes may have been influenced by the aerodynamic characteristics of the suspended structure. There is, however, no convincing evidence that the vertical oscillations were caused by so-called aerodynamic instability. At the higher wind velocities, torsional oscillations, when once induced, had the tendency to increase their amplitudes.” The body of knowledge on aeroelastic phenomenon was limited to Theodorsen’s paper on aerodynamic instability and flutter of airfoil published in 1934, but limited extension to bridges until Scanlan (Scanlan, 1971). Under limited evidence for observation of these phenomenon, the statement in the FWA report about the failure of the bridge seems justified.
The last line of the statement refers to an instability in the torsional mode of oscillation. This instability, dependent upon the aerodynamic characteristics of the bridge, is believed to be a consequence of aeroelastic phenomenon referred to as torsional galloping or stall flutter (stall not due to viscous effects). Aeroelastic phenomena occur in the domain of the intersection of aerodynamic, elastic, and inertial forces. The lack of inertial forces results in a static phenomenon like divergence, while the inclusion of inertial components results in dynamic phenomenon like flutter. Scanlan demonstrated that the failure mode was “SDOF torsional flutter” of a bluff body. Subsequent publications supported this mechanism. A non-catastrophic 1D flutter in plunge motion translated into a large amplitude 1D torsional flutter observed at the instance of collapse (Blevins, 1977; ASCE, 1987). The reason for the change in the mode of vibration from plunge to torsional is not well understood, with explanations ranging from slip-of-cable-mount during the plunge phase (Ammann, 1941; Malik, 2013) to a theoretically based energy threshold approach (Arioli, 2013; Arioli, 2015).
Aeroelastic Flutter
Flutter may be conceptualized as a self-exciting, aerodynamic phenomenon wherein a condition of positive feedback is established on the structure’s vibration by the aerodynamic forces. Note that this simplification is nuanced, and readers are advised to follow up with literature for a more accurate understanding of the phenomena. From the perspective of an oscillator, flutter may be conceptualized as an instability arising due to a negative net damping as a consequence of aerodynamic damping exceeding the inherent damping of the structure. An example of the oscillations considering a quasi-steady model (for illustration only, recent calculations utilize flutter derivatives for characterizing fluid force) is presented below (Blevins, 1977) to illustrate the onset of torsional galloping.
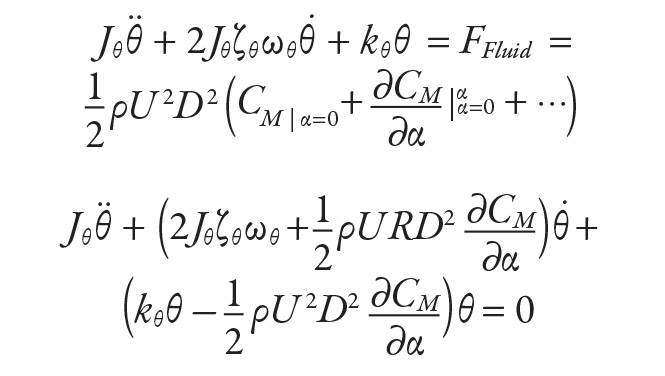 where Jθ is the polar moment of inertia, ζθ is the torsional damping, ωθ is the torsional frequency mode, kθ is torsional stiffness, ρ is the density of fluid, U is the fluid velocity, D is the cross-flow dimension, R is the Reynolds number, θ is the angular rotation, α is the angle of attack, and CM is the moment coefficient.
Upon examination of the damping term, the positive feedback (negative net damping) can occur under two conditions,
1) R ∂CM/∂α is negative (or can become negative due to motion), (Den Hartog Criterion) and 2) U exceeds a certain magnitude. The first condition, variation of lift coefficient (moment coefficient) with the angle of attack, is characteristic of the shape of the body. Circular sections are mostly insensitive to angle of attack (inclined cable stays in rain are excluded). The torsional oscillator equation shows that as the normalized wind speed for bluff body increases, the aerodynamic damping changes sign and, beyond a certain wind speed (critical velocity), results in a net negative damping introducing instability in structural vibration.
Mechanistically, this behavior may be visualized as aerodynamic forces deforming the structure while the elastic forces are restoring beyond the original undeformed state, providing positive feedback to the aerodynamic force. A visual illustration of the behavior can be viewed online (youtu.be/YzvFxF5LrRA). Figure 4 shows the CFD simulation of the deck section in increasing fluid flow. At low speeds, the flow is relatively consistent with the entire deck acting as a solid body. As speed increases, vortices form and oscillation occur at these speeds, if the frequency of shed vortices match the natural frequency of the deck. Further increases in wind speed will result in motion-induced forces due to vortices formed in the immediate vicinity, leading to large torsional moments and rotations.
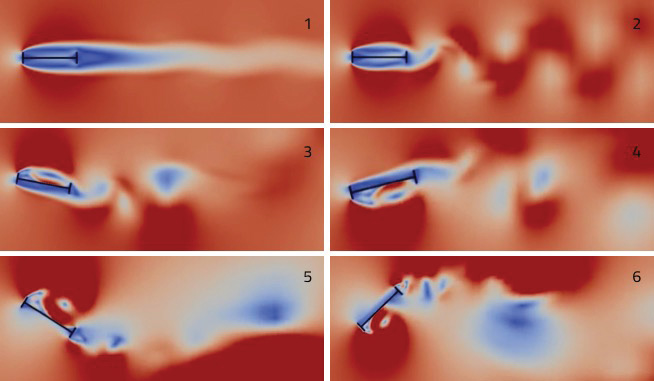
Figure 4. CFD simulation of H-section deck in increasing fluid flow –
created from (Wei, 2011).
Other Structures
The intricate nature of aeroelasticity is challenging to capture in the provisions of the design code. However, this behavior is expected in common structures like tall buildings and bridges, and some unsuspecting structures like single-axis solar trackers (Rohr, 2015). Figure 5 presents CFD simulation of single-axis solar trackers stowed near-flat, illustrating behavior similar to the bridge deck.
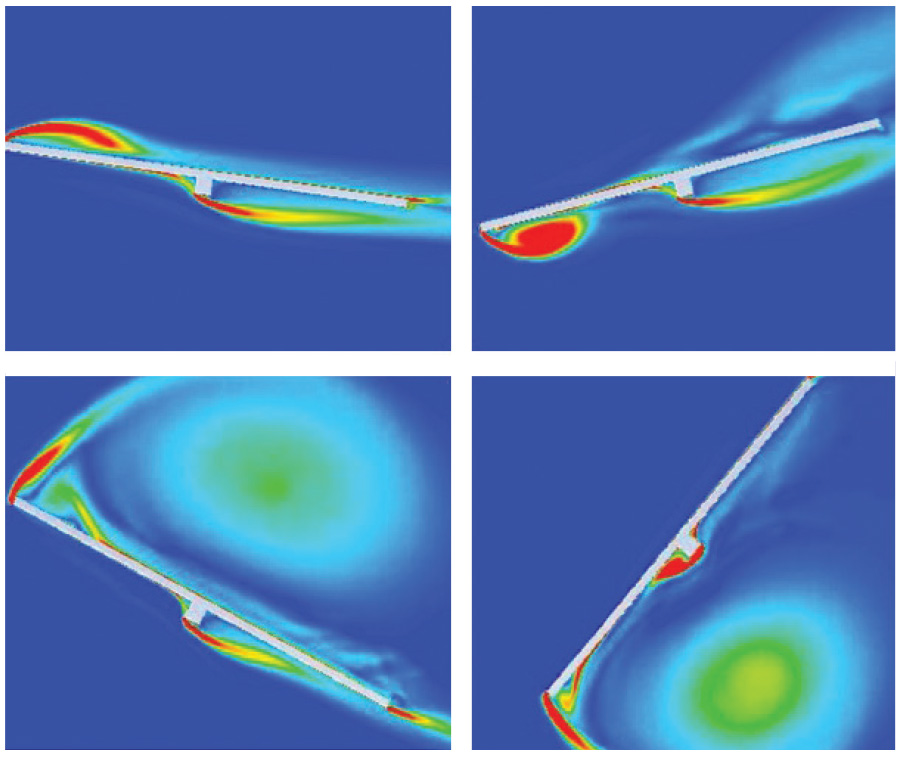
Figure 5. CFD simulation illustrating the torsional instability of single-axis solar trackers (Rohr, 2015).
A review of the failure of TNB is provided to illustrate the role of aeroelasticity on structural behavior. The objective is to encourage designers to contemplate possible aeroelastic effects of the designed structure due to wind.▪
References
- WSDOT, Lessons From the Failure of a Great Machine, WSDOT, [Online]. Available: https://bit.ly/1oWbaWc. [Accessed 10/12/2017].
- O. H. Ammann, T. V. Karman and G. B. Woodruff, The Failure of The Tacoma Narrows Bridge, Federal Works Agency, Washington, D.C., 1941.
- L. S. Moisseiff, “Growth in Suspension Bridge Knowledge,” Engineering-News-Record, 123, 207-208, 17 August 1939.
- A. Pasternack, The Strangest, Most Spectacular Bridge Collapse (And How We Got It Wrong), [Online]. Available: https://bit.ly/2xw174p. [Accessed 03/01/2018].
- “A Great Bridge Falls,” New York Times, 09 November 1940. [Online]. Available: https://nyti.ms/2Ld5tQ1. [Accessed 03/01/2018].
- F. M. Miller, College Physics, 4th ed., 1977.
- W. W. McCormick, Fundamentals of University Physics, 1969.
- K. Y. Billah and R. H. Scanlan, “Resonance, Tacoma Narrows bridge failure, and undergraduate physics textbooks,” Am. J. Phys, 59(2), 118-124, 1991.
- R. H. Scanlan and J. J. Tomko, “Airfoil and bridge deck flutter derivatives,” J. Eng. Mech., 97, 1717-37, 1971.
- D. Green and W. G. Unruh, “The failure of the Tacoma Bridge: A physical model,” Am. J. Phys, 74(8), 706-716, 2006.
- E. H. Dowell, A Modern Course in Aeroelasticity, 2015.
- R. D. Blevins, Flow-induced vibration, 1977.
- ASCE, Wind Loading and Wind-Induced Structural Response, ASCE, 1987.
- J. Malik, “Sudden lateral asymmetry and torsional oscillations in the original Tacoma suspension bridge,” J. Sound Vib, 332(15), 3772-89, 2013.
- G. Arioli and F. Gazzola, “A new mathematical explanation of what triggered the catastrophic torsional mode of the Tacoma Narrows Bridge,” Applied Mathematical Modelling, 39(2), 901-912, 2015.
- G. Arioli and F. Gazzola, “Old and new explanations of the Tacoma Narrows Bridge Collapse,” In Atti XXI Congresso AIMETA, Torino, 2013.
- D. WEI, “CFD Simulation of Flutter (Tacoma Bridge),” Available: youtu.be/YzvFxF5LrRA. [Accessed 03/01/2018].
- C. Rohr, P. Bourke and D. Banks, “Torsional Instability of Single-Axis Solar Tracking Systems,” In Proceedings of 14th Int. Conf. Wind. Eng., Brazil, 2015.
- Co-operative Institute for Meteorological Satellite Studies (CIMSS), (2001), University of Wisconsin-Madison (https://bit.ly/2H7JcR2)