
How do you create a new entrance for a world-famous technology university? It must act as an enduring symbol for those entering the university for the first time as well as for the students and faculty every day. It must represent all that is best of what is technologically possible now in the built environment, be rooted in the history of the institution, and look forward to what will be possible.
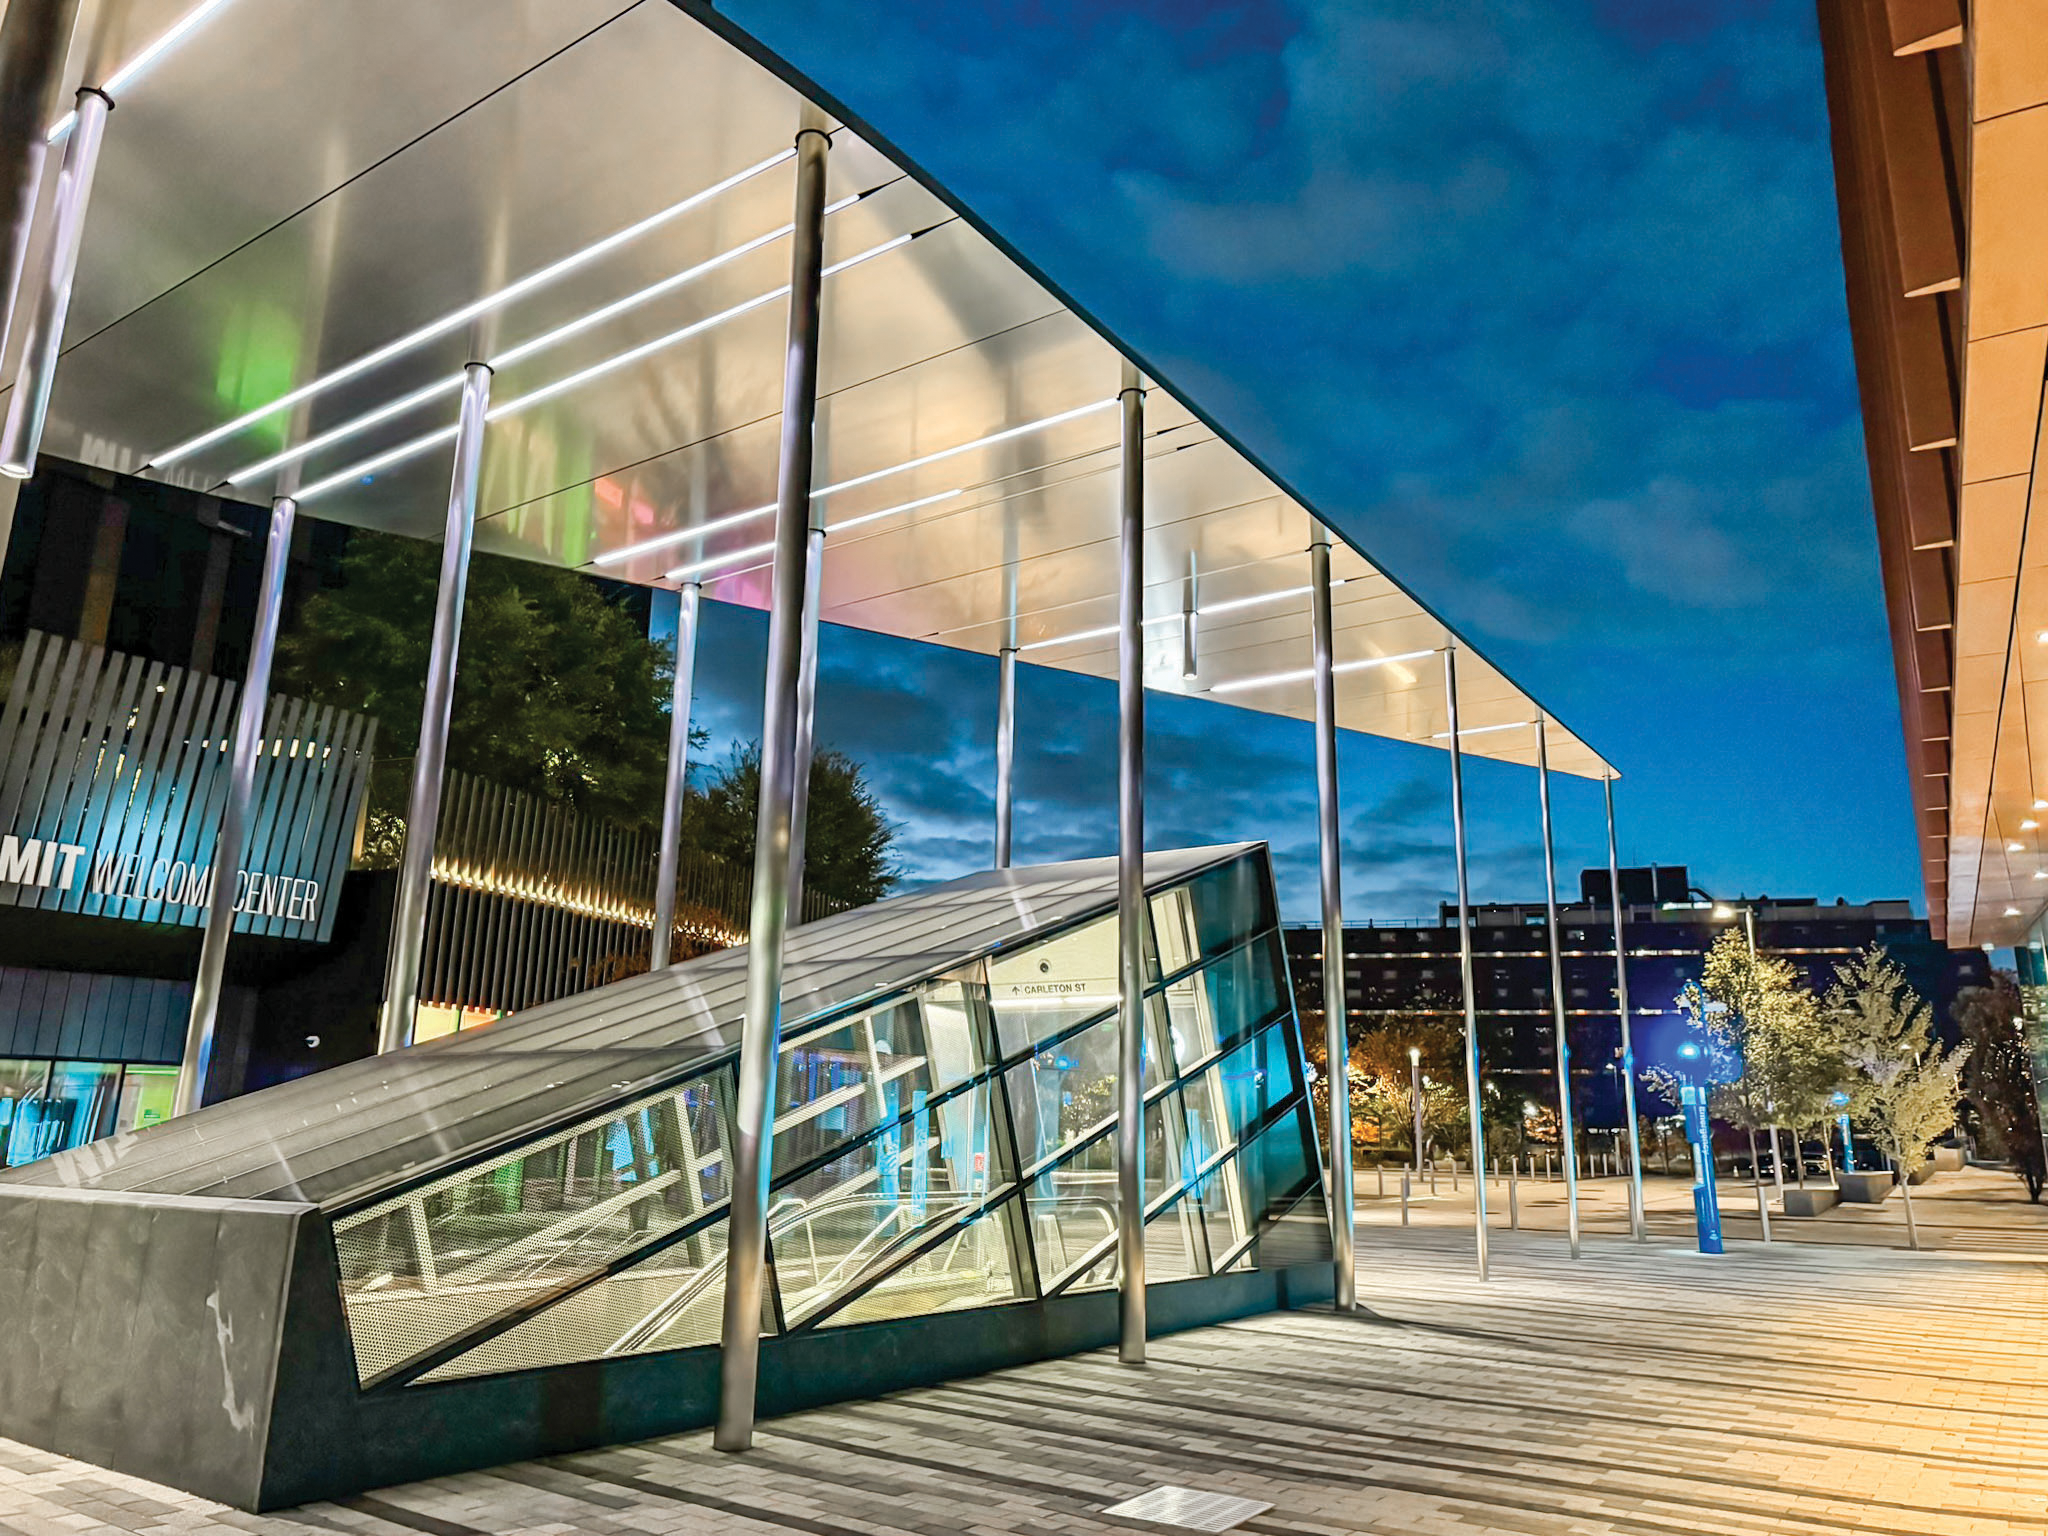
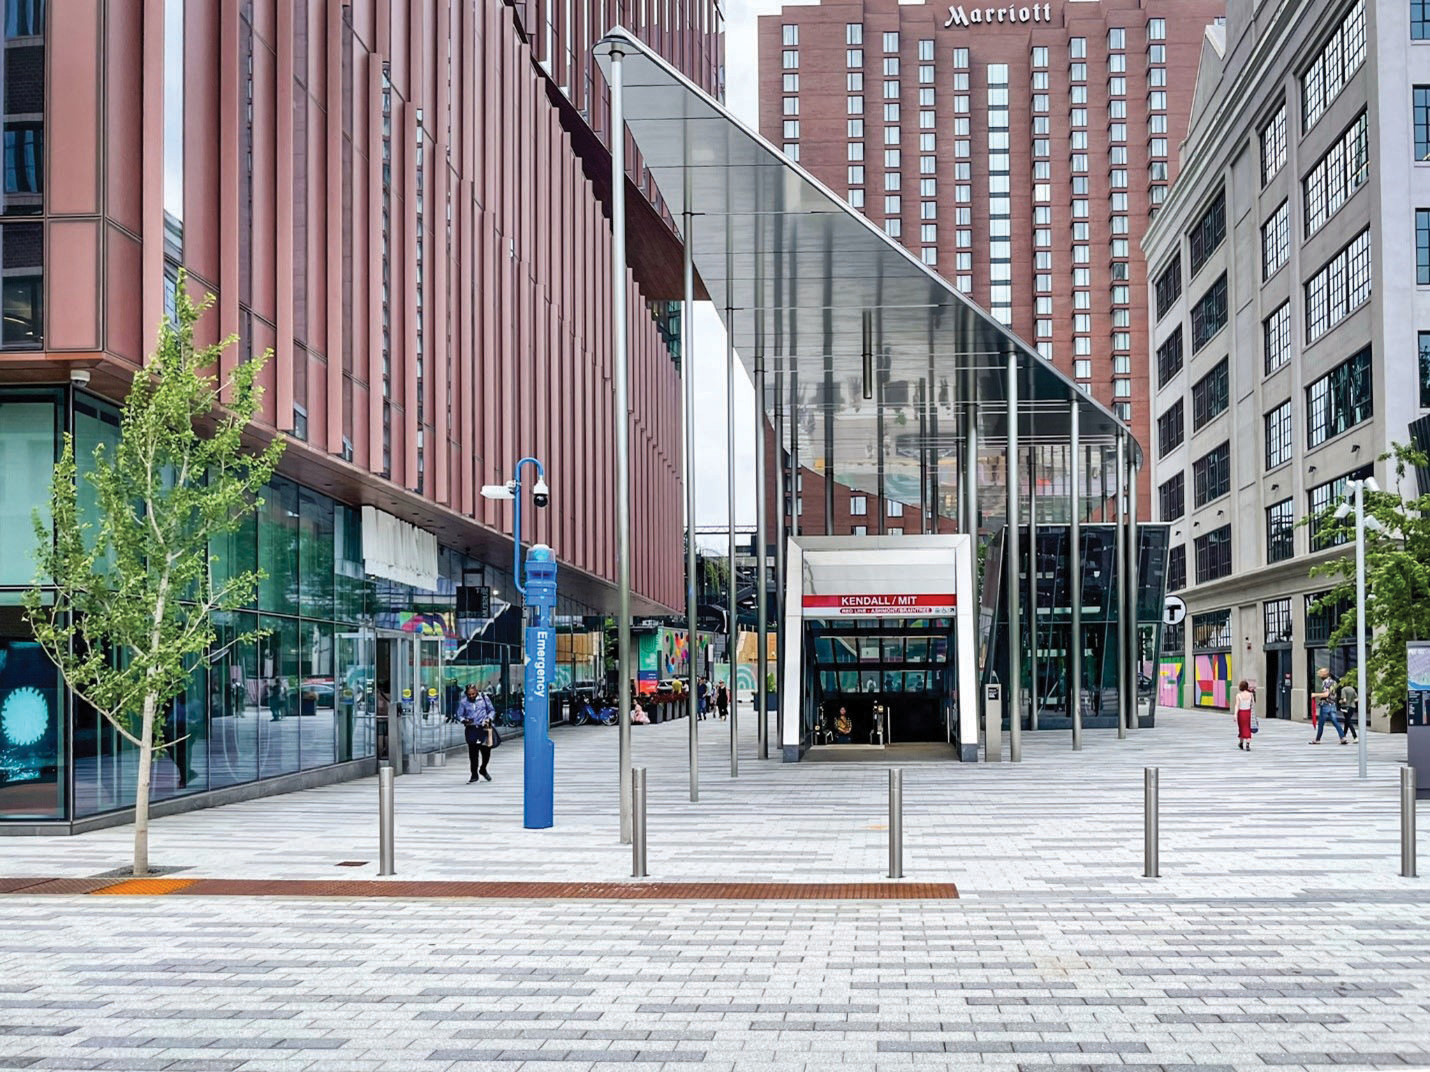
This is the new MIT entrance pavilion in Cambridge, Massachusetts, designed by Simpson Gumpertz & Heger (SGH) using first principle structural concepts, built with carbon and glass fiber, optimized with AI/machine learning, and fabricated by boat builders (Figure 1).
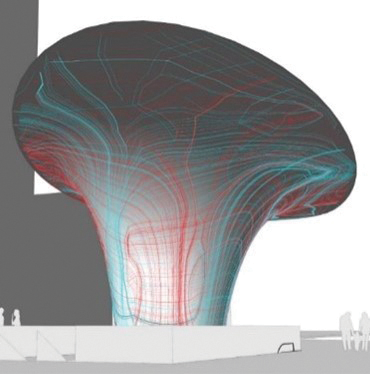
Initial Concept Design: Principal Stress Patterns
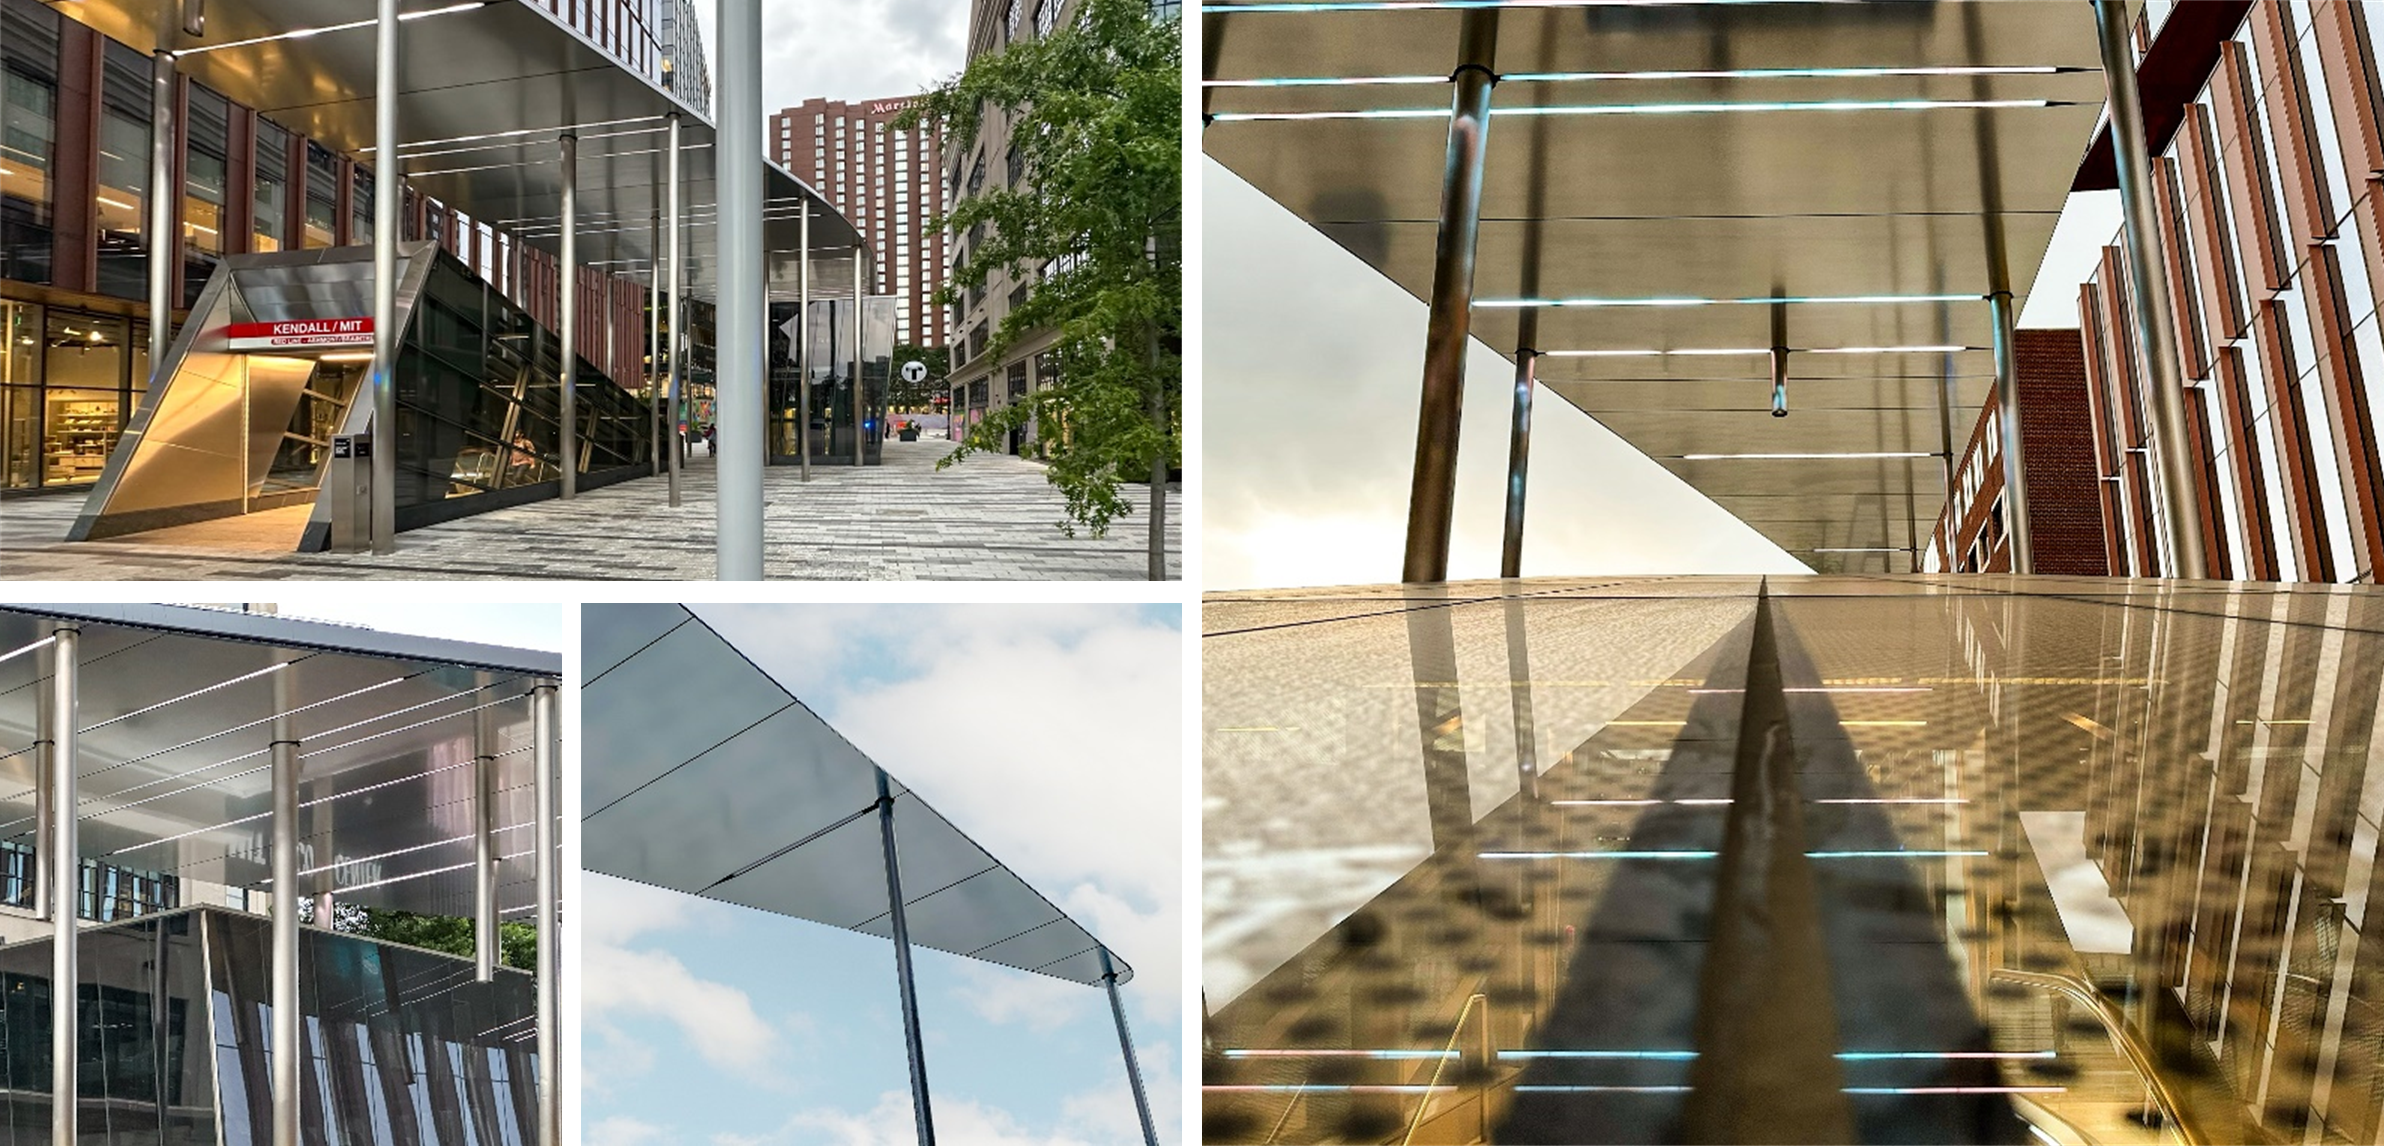
Located above the MIT-Kendall Metro station, the new entrance pavilion points towards the main campus and, specifically, the famous infinite corridor of MIT. With the physical constraints of the two metro headhouses and the elevator below, the pavilion had to touch the ground lightly and sparingly.
Following the MIT motto of “mens et manus” (“mind and hand”) representing the ideal of education for practical application, the design team used an approach of principal stresses and topological optimization to aid with early form finding. For those familiar, this approach only produces singular optimized forms when the solution parameters are defined clearly. At the same time, many options drive the design process: e.g., focus on self-weight, include lateral forces, maintain a form, define internal reinforcement, allow the form to be defined by the principal stresses, etc. We explored different options as an iterative discussion point with the design architect and record architect. Examples of a few of these options are shown in Figure 2.
In parallel, we discussed materiality to represent technology, including early thoughts such as a stone and titanium structure (to form a 3D reverse-arch structure that would complement and advance the nearby Collier Memorial), metal foams (lightweight and stiff cellular material researched by MIT faculty), and others.
Ultimately, the two above design approaches of structural system and materiality fused to produce a 160-ft. long FRP shell structure 26 ft. in the air on multiple slender steel columns. Fiber-reinforced polymer (FRP) uses high-strength fibers in a polymer matrix to form a composite material which, unlike reinforced concrete, can easily have the thin fibers aligned in various directions to align with inherent stresses, essentially a fully designed material. Thus, this project represented the use of one of the newest structural materials (FRP) for a stiff, angular pavilion structure, the inclusion of newer fabrication techniques to the risk-averse construction industry (here from the boat building industry), and the ability to adapt the placement of multiple columns to meet multiple needs of structural optimization, pedestrian access, safety, and visibility.
Bridge and boat design approaches for the FRP shell structure used an outer stressed skin with material placed where best for overall bending and with internal stiffening diaphragms to allow the outer panels to be fully utilized while also providing stiff load paths for the local column loads to connect with the overall structure (and avoid shear lag problems seen on the early steel box girder bridges such as Milford Haven/Cleddau and Westgate bridges).
Column Layout Development
Much of the design iteration between engineer and architect moved fluidly in scale from the overall approach to details of the hidden perimeter gutter, etc. This was necessary as the pavilion is a singular object of structure and architecture. Here, we provide just two examples of many that are related to the design process.
AI/Machine Learning
The Architect (NADAAA) challenged the team to determine which column layouts would provide the best distribution and allow for the thinnest columns. No-go areas compounded the problem for headhouses, emergency egress, below-grade structures, and sight lines. The combination of these various constraints prevented the column layout from following a typical bilaterally symmetrical and evenly distributed pattern. Asymmetrical support of the FRP shell structure further enforced the need to analyze the effects of specific column configurations rigorously.
Given the remaining candidate areas for the columns in the plan, we began to establish the parametric layout logic. To introduce sufficient regularity for fabrication purposes, a series of linear runs of column locations were defined. Each linear run could then be subdivided into N number of regularly spaced columns. Following this logic, the 11 resulting runs of columns could each have between one and (length/min spacing +1) columns. The range of possible cross-section diameters additionally compounded the size of the parameter space. Note the HSS steel columns act as vertical cantilevers and also the lateral system of the overall structure. Thus, their location and size directly affect overall system stiffness, which, in turn, directs the load to each column.
We initially planned a typical brute force analysis approach but realized the solution space was over 200 million model options (more precisely, 11^8), and even at 30 seconds per analysis run using SAP2000, it would take approximately 200 years to run all options! We were also wary of traditional optimization methods, which converged on a single optimum that was potentially not favorable aesthetically. We needed a better way of exploring more diverse yet still relatively high-performing local optima.
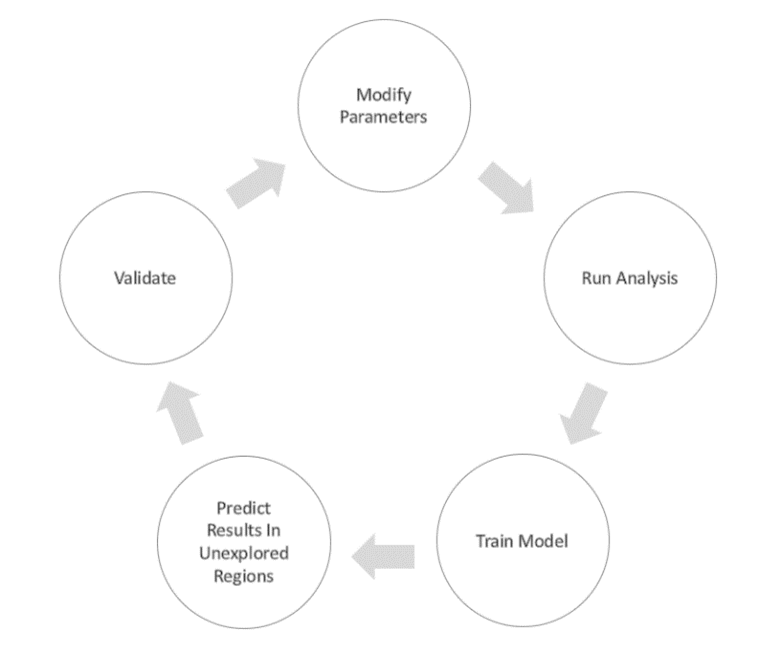
In the summer of 2018, the SGH Digital Lab explored a machine learning-assisted optimization strategy for predicting higher-performing regions of the parameter space and based this on previous research by Sjoberg et al. Given the predicted set of diverse yet high-performing configurations, we could then perform validation analysis on the designs and discuss their merit as final design candidates. To create a predictive model of performance, we produced a training set for our supervised neural network model. Each object in the training set consisted of the normalized spacing and size parameters for the columns, as well as the resulting demand capacity ratio (DCR) values for the columns and maximum stress and deflection values for the FRP shell.
The entire workflow, including parametric modeling, meshing, property/load assignment, and result collection, was automated across multiple software programs to run the analyses iteratively and collect data for the training set (Figure 3). The team created a parametric model using Rhino and Grasshopper, then wrote custom nodes in C#, which used the API for SAP2000 to insert the meshed geometry into a template SAP2000 file and assign properties/loads. The script also controlled the execution of the analysis runs and the logging of result data. Once this pipeline was completed, we generated a random sampling of the parameter space and allowed the analysis iteration loop to run overnight. The resulting dataset of 1300+ input/value pairs gave us some limited insight into the higher-performing regions of the solution space. Still, the high dimensionality made direct interpolation between input vectors unproductive. The goal was to explore whether the supervised machine learning model would be more capable of filling the gaps between the parameter combinations than our previous interpolation methods.
With the training set populated, we began the process of selecting the network architecture. We split the already small training set to allow for a validation set between 100-300 pairs. We tested various commonly used parameter encodings and activation functions to avoid over-fitting and select our final architecture. Training was relatively fast with the small dataset, allowing us to make modifications quickly and monitor loss metrics. Ultimately, once we were satisfied with the performance when predicting the validation set, we explored the parameter space with our predictive model.
Two methods were used to leverage this new model. The first and simplest was to quickly generate a larger random sample of possible designs and their predicted performance values. Since the machine learning model in milliseconds could now predict each design’s performance, we were able to generate 10,000+ pairs and store them in CSV format quickly. We then filtered out rows with result values outside of the desirable ranges. We sorted the data by the performance metrics to manually identify a diverse yet performative set of potential designs.
The second method we explored was to use the trained network as a fitness approximator within a genetic algorithm. Genetic algorithms are a type of solver that works by iteratively creating populations of solutions, evaluating them using a “fitness” function, and creating a new population from some of the characteristics of the top performers plus some random “mutations.” We set up a custom implementation of this solver in Python and reviewed the top solutions it produced. Ultimately, the solutions that this method provided were not a significant improvement over the best results of our large random sampling.
Each of the selected designs would then move on to the validation stage, where the model was regenerated from the input parameters, and the actual analysis results could be collected for comparison to the predicted. Of the predicted top performers, we filtered for those whose performance was verified through analysis. We manually selected a small but diverse series (a “top 10”) to review with the architect and project team.
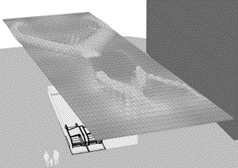
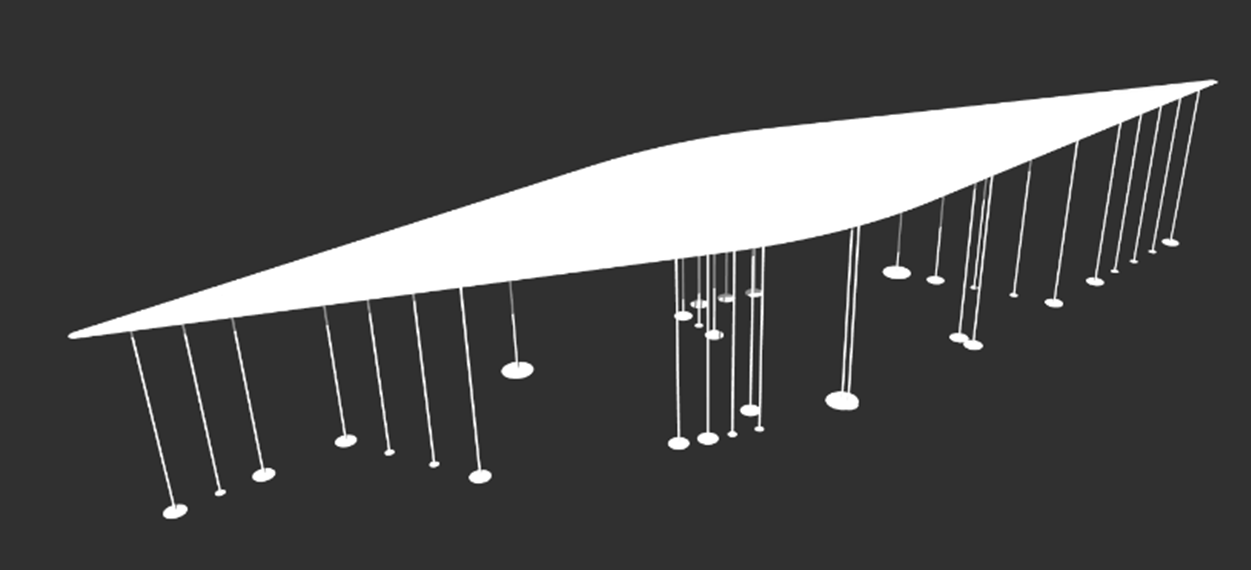
Ultimately, this study took two days to set up, two days to run, and one day to check—far less than 200 years. We provided the diverse “top 10” to the Client as 3D online models using an internal tool developed by the SGH Digital Lab. One example is shown in Figure 4 as a static image of the model where we used circles as visual indicators of the vertical loads at the column bases (which is a visual simplification recalling the model is more complex than gravity-only as the columns are the lateral system and hence integral with the overall gravity and lateral stiffness of the system).
Column Performance Criteria
The building code prioritizes stiffness as it relates to the consequences of movement (e.g., cracks in brittle finishes, etc.). In the case of pavilions, sculptures, and other touchable/visible structures, there is little guidance. There are cases of acceptable large movements in outdoor structures/sculptures such as Harry Bertoia’s sounding sculptures in Chicago and elsewhere, Skylar Tibbits’ “Resonance” sculpture in the Boston Seaport (structural design by SGH) for human interaction and movement, and even long cantilever traffic lights at wide intersections seen worldwide.
We proactively had a meeting with the design team and owner to share expected movements at various wind speeds during the design stage. From experience, setting expectations on non-standard projects while still in design is far better than providing justifications in response to concerns after construction.
We used the combined approach of the Beaufort scale to represent various wind speeds as relatable descriptions (e.g., “Inconvenience felt when walking against the wind” for 32-38 mph winds) and produced animations of expected pavilion structural movement seen from a pedestrian at ground level. This produced a helpful discussion related to the multiple shareholders, such as pedestrians, the Boston Metro Department (MBTA), and tenant views from the adjacent buildings.
We did similar studies up to 120 mph hurricane winds showing what that is actually like outside (typically not experienced as people are told to “Take refuge …stay away from windows.”). Hence, the larger visible movement of the pavilion would likely be one of the least concerns of people if and when such an event occurs .
With these expectations established, the owner accepted a H/120 horizontal deflection for the canopy under the code-level wind loads (where H was the height of the canopy in inches), which is significantly less stringent than the industry standard for occupied structures (H/600 to H/400). This increase in allowable deflection was critical to maintaining the slender columns the architect envisioned for the project but still kept the canopy movement nearly imperceptible during the 32-38 mph winds (deflections smaller than H/1000).
FRP Design Responsibilities
When approaching a standard building project with standard delegated design elements, the team generally knows and understands the roles and responsibilities of each individual party (e.g., with the delegated design of a curtain wall system) to meet the performance criteria, applicable building code requirements, and the standard of care.
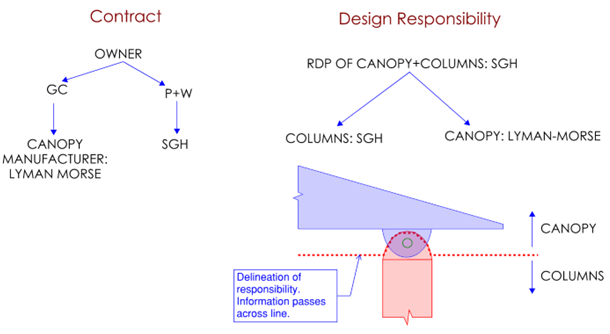
For the FRP canopy, as structural design progressed, the combination of a unique design and unique procurement through boatbuilders meant this required a clear definition as it made sense that the FRP subcontractor would take on final responsibility for the design of the FRP, being able to select materials and construction methods preferred by their shop, while SGH maintained responsibility for the columns and the connection to the lid structure. As noted previously, the behavior and, thus, design of the FRP canopy was directly linked to the location and stiffness of the columns and vice versa. This is analogous to delegating the design of the beams in a moment frame while maintaining responsibility for the column design and the overall moment frame.
At the request of MITIMCo (the client, the investment arm of MIT), SGH took on design responsibility for the overall pavilion system of the columns and the canopy. Given the integrated nature of the system, this required the FRP subcontractor to account for the column stiffness in their model and for SGH to review the entire FRP canopy design for proper consideration of the supporting structure, the columns, and the FRP canopy itself, including compliance with all building code requirements. SGH provided the diagram in Figure 5 to all parties during design to explicitly clarify this arrangement. Although the diagram may be simple, it clarified multiple misunderstandings in the team from email/meeting discussions and set the project up for success.
FRP Code Applicability and Testing
With standard building materials, we have individual codes to follow during design, such as ACI 318 for concrete and the AISC Steel Manual for steel. At this point in time, the IBC does not have an “FRP Manual.” There are general provisions within the IBC for plastics, including some specific to FRP, but these primarily relate to fire and thermal performance. The design strength of the material falls under IBC 1706.2 “New Materials,” where the design strength and permissible stresses are to be established via tests found to be acceptable by the building official.
For the structural design of the materials in the FRP canopy, the FEA model was based on predefined material properties from the manufacturer, Vectorply, who then performed destructive physical testing on the materials to verify the assumed properties were conservative and thus acceptable. All the testing information, including fire performance testing, was reviewed and accepted by the construction team, design team, and building official to confirm the adequacy of the proposed system for the final construction of the FRP canopy.
Analysis Approach
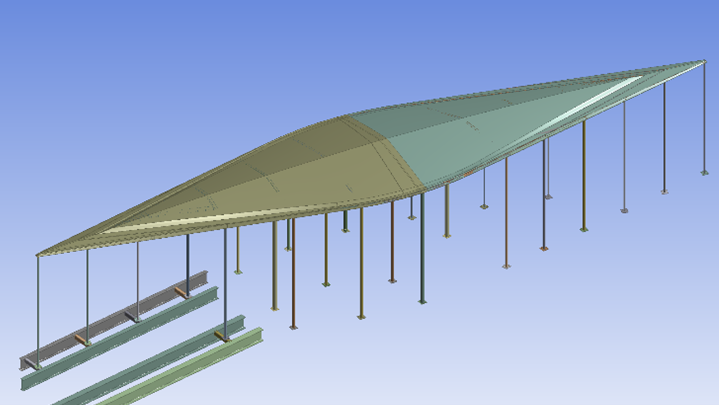
During the latter portion of the design phase, the canopy analysis was done in SAP2000, developing conservative weights and stiffnesses for the FRP canopy and a preliminary design for the columns. Once in construction, the FRP subcontractor, with input from SGH, developed an integrated FEA model in Ansys Mechanical. The model included core and skins for the top and bottom canopy panels, canopy bulkheads (including access panel openings), solid attachment bracket locations, stainless steel columns, and composite steel beams of the supporting structure below. The lid structure of the metro station below was mostly a 14-in. thick concrete structure, but five of the columns were located over concrete on a metal deck with composite steel beams. Given how sensitive the structural load paths were to relative stiffness, the less stiff support condition at the composite steel beams needed to be accounted for in the model (Figure 6).
The analysis included a residual capacity analysis on the stainless steel columns based on ASCE 7-10 Section 2.5.2.2. This did not consider any impact or other loads imposed by the damaging event. Instead, it focused on the redistribution of loads after one of the load-bearing elements is damaged to the extent it no longer contributes to the structural system. The residual capacity analysis concluded that the columns have sufficient residual capacity to prevent progressive collapse should any one column be unable to support any load following the occurrence of a damaging event.
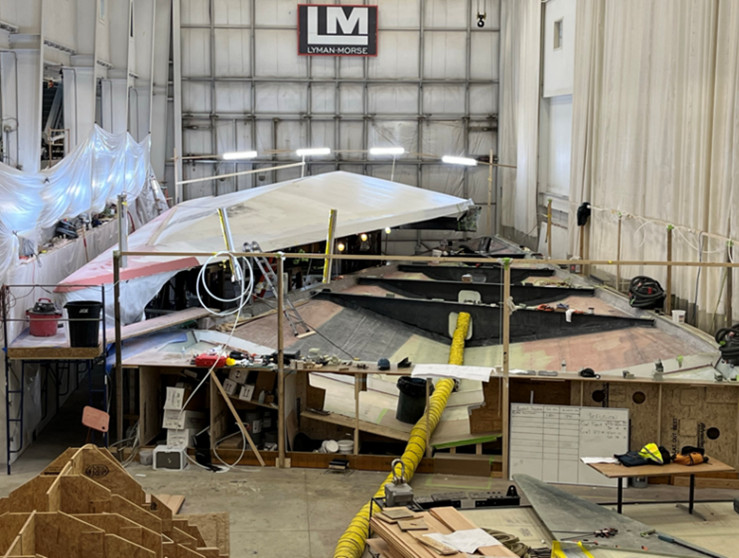
Mold in Two Halves and Infusion
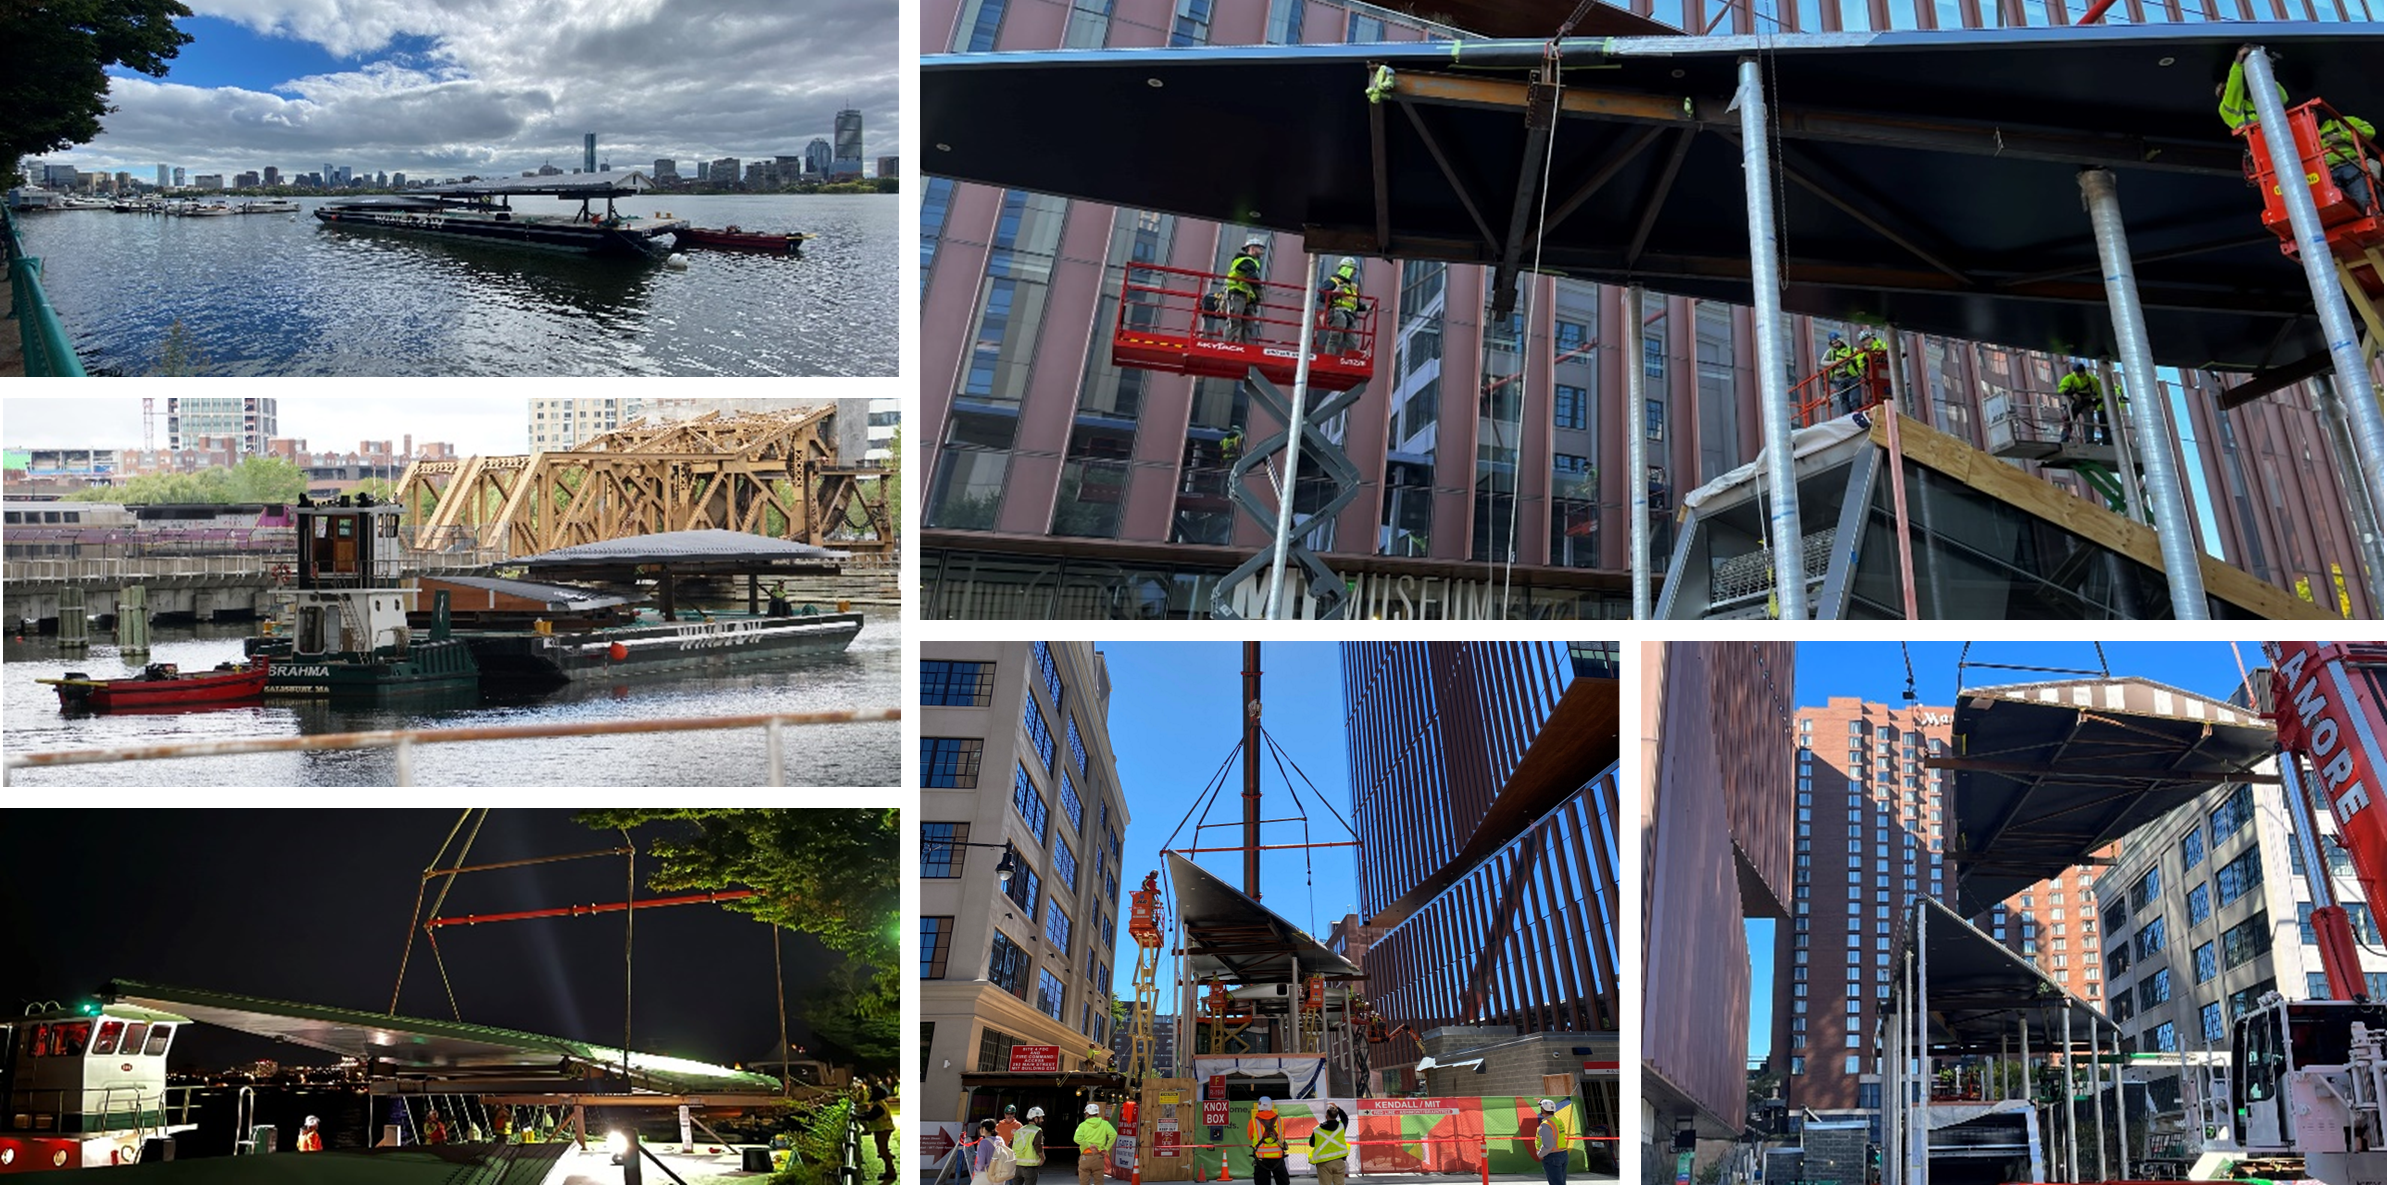
During the FRP design, the project team actively discussed the logistics of transporting the canopy from the boatbuilder’s shop in Maine to the project site in Cambridge. Given the proximity of the final site to the Charles River, the intent was to put the canopy on a barge to travel down the coast and be picked off the boat in Cambridge. Given the 160-foot length, the team decided to build the canopy in two halves that would then be connected onsite in Cambridge. The two halves could fit on the same barge and would be more manageable to erect onsite.
The actual fabrication of the FRP canopy was similar to that of a boat. Each top-side half was molded and infused upside down as one piece. Given the rotational symmetry of the canopy, the same mold was used for both halves. The bulkheads were hand-laid onto this top surface in the shop, and the bottom panels were individually molded and infused. The two halves were then packed on the barge and shipped down the coast (Figure 7).
Installation on Columns
The stainless steel columns were installed prior to the FRP canopy’s arrival on the site. The columns were temporarily bolted in place with oversized holes to allow for adjustments to the column locations if needed.
While the columns and canopy were being constructed, many installation logistics were finalized. The arrival of the FRP canopy had to be timed such that the columns were already installed and to avoid conflicts with multiple events in the area, especially given the need to shut down roadways between the barge on the river approximately half a mile down the road from the project site.
The FRP canopy arrived in Cambridge during the day on September 21, 2022, and was picked by crane off the barge on the night of September 23, when the appropriate roads could be closed (Figure 8). Once at the site, the south half was picked first and placed on the previously installed columns, columns plumbed and fully welded in place prior to the canopy being released by the crane. The same process followed with the north half, and the two halves were then bolted together.
Over the next several months, the canopy received its finishing touches, including the installation of the metal soffit cladding for the lighting and other elements designed in close coordination with the structure and architecture, prior to the site officially opening to the public in February 2023 (Figure 9). ■
References
- “Report on Collapse of Milford Haven Bridge Fatal Accident 2nd June 1970″, Sir Hubert Shirley-Smith. It is not readily available but summarized in the following reference.
- “Report of Royal Commission into the Failure of West Gate Bridge” 1971, Victoria, Australia. https://www.westgatebridge.org/sites/default/files/downloads/report-of-royal-commission.pdf (Last Accessed October 2023)
- Sjoberg, Christian & Beorkrem, Chris & Ellinger, Jefferson. (2017). Emergent Syntax: Machine Learning for the Curation of Design Solution Space. 552-561. https://doi.org/10.52842/conf.acadia.2017.552.
- Jin, Y. A comprehensive survey of fitness approximation in evolutionary computation. Soft Computing 9, 3–12 (2005). https://doi.org/10.1007/s00500-003-0328-5
- Beaufort wind scale quote: https://www.metoffice.gov.uk/research/library-and-archive/archive-hidden-treasures/beaufort-scale (Last Accessed October 2023)
- Shelter in place quote: https://www.weather.gov/safety/hurricane-action (Last Accessed October 2023)