
Why Is Everyone Talking About Performance-Based Multi-Hazard Design?
The design for multi-hazard mitigation is a new subprinciple of structural engineering, aiming to protect structures from hazards (earthquakes, winds, tsunamis, snowfalls, floods, wild-fire, etc.). This is done by anticipating damage, minimizing consequence losses, and targeting fast recovery in the event’s aftermath. Recurring hazards may be independent or interrelated (concurrent or successive). Earthquakes and winds are typical examples of independent actions, while heavy rain and high winds, main earthquake shocks, and aftershocks are examples of concurrent and successive events, respectively.
Following major international codes, generations of practitioners have been designing buildings to sustain the maximum load expected during their lifetime. This widespread worst-case scenario approach provided society with strong structures of increased initial cost and unmeasured reliability. Reliability is the probability of the structure to meet its performance target under the operating conditions encountered during the intended period of use. Earthquake engineering was the first discipline to introduce Performance-Based Design (PBD), targeting desired system performance at various levels of excitation. The design earthquakes range from service to near collapse events and are associated with a certain probability of exceedance in the life of the structure.
The mapping of performance objectives to expected excitation levels enabled the cost-effective seismic design of structures. PBD uses capacity design principles to proportion lateral actions in well-detailed, ductile elements, such as braces, beams, and columns. Following a strength hierarchy, deformation-controlled (ductile) elements dissipate input seismic energy through yielding, while force-controlled elements (beams and columns supporting gravity loads) remain elastic. PBD procedures aim to ensure habitat comfort and continuous service under minor events and collapse prevention and life safety under significant events.
Today, PBD has evolved to the point where state-of-the-art software is used to perform nonlinear collapse simulations. In contrast, probabilistic methodologies relate seismic performance factors to system performance capabilities, quantify damage and estimate potential losses through life-cycle cost analysis. Equation 1 is the benchmark relation for seismic loss evaluation (Porter, 2003):
g[DV|D]=∫∫∫p[DV|DM,D] p[DM|EDP,D] p[EDP|IM,D] g[IM|D] dIM dEDP dDM (Eqn. 1)
This relation shows how risk assessment can be disaggregated in (i) hazard characterization for the definition of the intensity measure (IM), (ii) structural analysis for the estimation of the engineering demand parameters of interest (EDP), such as drifts, floor accelerations, and stresses, (iii) fragility assessment for the prediction of damage measures (DM), and (iv) loss analysis for the estimation of decision variables (DV). In fragility analysis, the selected demand parameters are input to mathematical functions that model limit state probabilities. Damage limit states describe performance goals and are usually associated with inter-story drift and floor acceleration thresholds. Decision parameters quantify the structural performance of components and facilities in meaningful metrics to stakeholders, for example, repair costs and downtime. Optimized performance-based design minimizes the total expected life-cycle costs, balancing initial and expected failure costs. The risk is defined as the probability of exceeding threshold values of the decision variables. Risk assessment is conditioned on the site and selected design (D). Due to uncertainties relative to the hazard, the recorded data, and the modeling of the system, each of the parameters in Equation 1 is considered within a probabilistic context and described by a probability density function (pdf), p, where p[X|D] is the pdf of parameter X conditioned on the knowledge of D. Moreover, g[X|D] is the occurrence frequency of X given D.
Similar advancements are expected to occur in wind engineering, nevertheless at a slower pace owing to the complex nature of wind loads and the significant computational effort required to perform wind history simulations. Two key elements for the advancement of performance-based wind engineering are the refined estimation of loads through wind tunnel testing and the implementation of nonlinear procedures to predict wind-induced demands. Similar to seismic design, models employed in wind design account for member overstrength and allow for yielding of well-detailed members, designed to resist extreme events without significant loss of strength and stiffness. Equation 1 can be easily adapted in performance-based wind design, where the wind intensity is considered as the mean wind speed at a reference height of approximately 32.8 feet (10m).
Current wind practice following major international standards conforms to prescriptive acceptance criteria accounting for stiffness and strength, delivering systems of unquantifiable reliability. The strict wind criteria compromise the benefits of inelastic seismic design for structures designed to resist both winds and earthquakes. The stiffening of the lateral force-resisting system, often required to satisfy stringent wind service criteria, increases initial and potential failure costs, may lead to reduced energy dissipation, trigger unfavorable distribution of forces on force-controlled members, and put life safety at risk under extreme events.
Multi-hazard Design Concept
Developing PBD approaches for multiple hazards is a significant step towards building a resilient and sustainable civil infrastructure. Figure 1 illustrates the concept of multi-hazard approaches developed by various experts in the field. The design starts with the probabilistic definition of the hazards, expressed in intensities of various mean recurrence intervals (return periods). The use of return periods enables the comparative assessment of induced risks since various hazards are expressed in incompatible units; for instance, winds are described by wind speeds and earthquakes by ground accelerations. Furthermore, if the considered hazards have negligible probability of concurrence, they can be considered independent, and analyses under the single hazards can be run separately.
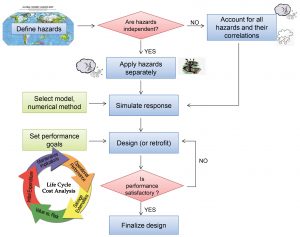
The development of an accurate structural model, accounting for P-delta effects, material nonlinearity, and fatigue under cyclic loading, is salient for accurate performance evaluation. The peak response (demand parameters) may be assessed through deterministic nonlinear response history simulations or probabilistic methods. Deterministic response history analyses provide insight into the transient response of dynamic systems under case-specific scenarios. However, probabilistic methods have the advantage of simulating physical, artificial events and accounting for aleatory and epistemic uncertainties in the data.
The designer, in accordance with the owner and stakeholders, shall set the performance objectives. These objectives are usually expressed in damage limit states and consider occupant comfort under frequent wind loads, life safety under extreme ground motion, optimal life-cycle costs, minimal disruption on environment and resilience, etc. Costs over the life of the structure include damage and repair costs, relocation costs, indirect costs, costs caused by injuries, and fatalities (Wen and Kang, 2001). Whereas the dominant hazard controls the optimal design, the less intense hazard may contribute significantly to the overall damage and life-cycle costs and should not be ignored. This implies that a performance-based multi-hazard framework targets optimal design and does not require uniform reliability against different hazards (Wen and Kang, 2001).
Case Study
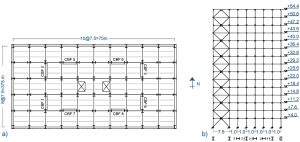
A 15-story office building in Montreal’s downtown is designed for typical seismic and wind loads following the 2015 National Building Code of Canada (NBCC) provisions. Figure 2 shows the typical floor plan and associated N-S elevation for the building. Eight Concentrically Braced Frames (CBFs) with tension-compression braces provide resistance under lateral actions in the two orthogonal directions. The example focuses on the N-S direction.
Initial Design
Following the equivalent lateral force procedure (clause 4.1.8.11, NBCC 2015), the minimum seismic base shear is Vmin = 665 kips (2958 kN). The base shear is distributed via the inverted triangular distribution approach along the building height to provide the input forces for the initial section design. A three-dimensional model of the structure is developed in ETABS (2016) to assess the dynamic distribution of the story shear and the associated drifts. With a fundamental frequency as low as 0.29Hz (T1 = 3.41s), the building is classified as dynamically sensitive under wind load, clause 4.1.7 in NBCC (2015). The net wind floor loads, Wi (i = 1,2,..15), are evaluated as the algebraic difference of wind- and lee-ward pressures, multiplied by the corresponding tributary area. The estimated factored wind shear is 1.4W = 1210 kips (5384 kN), i.e., lower than the elastic seismic demand, RdRoV = 2593 kips (11,536 kN), where Rd = 3, Ro = 1.3 are the ductility and overstrength related factors.
The tension-compression braces were initially designed so that the factored axial force under seismic loads, Cf, is less than or equal to the member resistance, Cr. The corresponding resistant factors Cf /Cr, under the factored wind loads (1.4W), take values that are greater in the lower stories where wind is prevalent. This slightly excessive wind demand is expected to be accommodated by the members’ overstrength. Hence, the brace sections are not further increased, resulting in a small material gain of 882lb (400kg) (the taller the structure, the higher the gain). The ETABs model verifies that the service level (0.75W) inter-story drifts lie below the limit value of 1/400 (NBCC, 2015).
Performance Goals
The performance of the building at the service, strength, and near collapse level is assessed through independent wind and seismic response history simulations of a sophisticated building model developed in OpenSees (2015). The model accounts for material nonlinearity, fatigue, and second-order effects. Performance is linked to peak inter-story drifts (δmax) and floor accelerations (αmax). Multi-hazard design is finalized once the following goals are achieved:
- Under service winds (0.75W, or 1-in-10 years), the building is habitable and there is no damage in the cladding (αmax < 20 mg and δmax <1/400), where g = 32.174ft/s2 (9.807 m/s2) stands for the standard acceleration due to gravity.
- For less frequent winds (1.0W, or 1-in-50 years), the response is elastic and mild damage is allowed in the cladding (δmax < 1/220).
- Under design-level earthquakes (1.0E, or 1-in-2,475 years), damage to cladding and structural components may occur (δmax < 2.50%); however, such damaged members are repairable/replaceable (δres < 0.50%), and life safety is ensured.
- For near-collapse winds (identified through incremental analyses), damage to cladding and structural components is allowed to occur, whereas there is a moderate risk to life safety.
More information on the selected thresholds can be found in Isymov (1993) and Griffis and Charney (2016).
Input Motions
Due to a lack of historical data for Eastern Canada, a set of seven ground motions for Montreal, soil C, is created via www.seismotoolbox.ca. The motions are scaled in amplitude to match the NBCC 2015 design spectrum in the period range [0.2, 2] T1. The motion duration is 18s, and the time step equals dt = 0.002s, whereas 10s of free vibration upon cessation of motion are included in the analysis.
An ensemble of 500 wind load sets is created via Monte Carlo simulations in MATLAB (2018) based on local pressure data retrieved from the wind tunnel testing of a geometrically similar building at Tokyo Polytechnic University (https://bit.ly/34L5maj). The data are scaled in time, and the time step is halved to 0.0665 seconds to ensure numerical convergence of the algorithm. The total wind duration is 4,365 seconds or approximately 1.2 hours. Due to computational limitations, only the five statistically most significant winds are considered.
Response at the Design Level
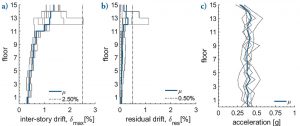
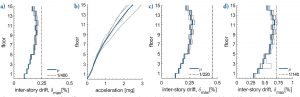
Figure 3 shows the peak system response under the design level earthquakes. The mean peak drift is lower than the 2.50% threshold, and the mean peak residual drift is less than the 0.50% limit, deeming the building repairable after the earthquake. Nonlinearity in the upper stories is responsible for the almost constant distribution of accelerations along the building height. Under service winds, Figures 4a and 4b, there is no damage in the cladding (δmax < 1/400), and occupant comfort is ensured (αmax < 20mg). For less frequent winds (1-in-50 years), Figure 4c, cladding remains operational (δmax < 1/220).
Response beyond the Design Level
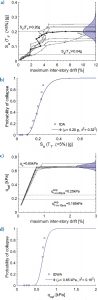
Figure 5a shows the Incremental Dynamic Analyses curves (IDA) relating the peak inter-story drift at the seismic intensity level Sa (T1,5%). The case-specific fragility curve is given in Figure 5b. The median collapse capacity is Sc = 0.20g and, once divided by the design intensity Sa = 0.04g, yields the collapse margin ratio CMR = 5. CMR is significantly larger for systems in which the inelastic response is more evenly distributed throughout the system (FEMA P695, 2009). Figures 5c and 5d show the wind IDA curves (IDWA) that relate the peak inter-story drift to the reference 32.8-foot-height (10m) pressure for the suite of five wind realizations and the corresponding collapse fragility curve. Near collapse, at qnc = 0.087psi (0.60kPa) or 2.4 times above the design wind level qexp = 0.036psi (0.25kPa), braces at the lower stories yield and damage occurs; nevertheless, such damage is repairable (δmax <1/140). The median collapse pressure is qc = 0.094psi (0.65kPa). Contrary to seismic failure, wind failure occurs soon after the first significant yielding of the system. At the design level, the seismic response is highly nonlinear, while wind response is purely elastic. This is because design winds (1.0W, 1-in-50 years) and factored design winds (1.4W, 1-in-500 years) are more frequent than design earthquakes (1-in-2,475 years). However, under severe windstorms, ductility should be exploited.
Since all performance goals are satisfied, the design is considered acceptable. Note that studies in the field of multi-hazard design are currently under development; hence, further issues such as across-wind actions, directionality effects, and life cycle cost analyses are also currently under development.
While this example refers to NBCC (2015), the proposed multi-hazard procedure can be easily implemented under any code/standard. Note that the major international codes/standards use a common theoretical framework for modeling dynamic load effects, with differences lying essentially in the definition of the wind field characteristics (Kwon and Kareem, 2013). The procedure starts with designing the LFRS for the prescribed seismic loads. Following this, the design team should verify that the LFRS has adequate strength and stiffness to resist code-prescribed wind loads. For taller buildings, the wind demands at bottom floors tend to exceed the members’ factored resistance. The initial section design is confirmed if such exceedance lies within a reasonable range, i.e., 10%-15%.
The fundamental concept of the procedure is implementing a multi-hazard design that is both effective and economical, allows the members to use their overstrength to accommodate slightly excessive wind loads at the design level, and exploits the dissipation capacity of well-detailed members under rare events. Once the initial section design is decided, the design team and project stakeholders select performance objectives consistent with the code’s requirements.
Typical performance metrics are acceleration and drift thresholds linked to serviceability and survivability limit states. ASCE/SEI 7-16 (2016), the pre-standard for performance-based wind design (ASCE, 2019), the manual for the design of tall buildings under wind (ASCE, 2020), and the papers listed herein provide thorough descriptions of performance objectives and acceptance criteria suitable for earthquake and wind design practice. The initial design and its conformability to the selected acceptance criteria should be assessed using nonlinear response history simulations (at the serviceability level, linear wind simulations are permitted). The building design and respective structural model are finalized once the acceptance criteria are satisfied.■
References
ASCE (2020) Manual for the design of tall buildings under wind, ASCE-American Society of Civil Engineers, Reston, Virginia.
ASCE (2019) Prestandard for Performance-Based Wind Design, ASCE-American Society of Civil Engineers, Reston, Virginia.
ASCE (2017) ASCE/SEI 7-16: Minimum design loads and associated criteria for buildings and other structures, ASCE-American Society of Civil Engineers, Reston, Virginia CSI ETABS (2016) Integrated Analysis and Design of Building Systems, Computers and Structures Inc, USA.
Federal Emergency Management Agency (FEMA) (2009) Quantification of Building Seismic Performance Factors, FEMA P695, Washington, D.C.
Judd J P and Charney F A (2016) Wind Performance Assessment of Buildings, Proceedings of the Geotechnical and Structural Engineering Congress, ASCE, Phoenix, Arizona.
Isymov, N (1993) Criteria for acceptable wind-induced motions of tall-buildings. Proceedings of the International Conference on Tall Buildings, CTBUH, Chicago, Illinois.
Kwon, D K, and Kareem, A (2013) Comparative study of major international wind codes and standards for wind effects on tall buildings, Engineering Structures, 51:23-35.
MATLAB R2018a (2018) The MathWorks, Inc., Massachusetts, United States.
National Research Council of Canada (2015) NBCC: National Building Code of Canada, 2015, 14th ed., Ottawa, ON.
PEER, Pacific Earthquake Engineering Research Center (2015) Open systems for earthquake engineering simulation (OpenSees).
Porter, KA (2003) An Overview of PEER’s Performance-Based Earthquake Engineering Methodology.
Wen Y K and Kang Y J (2001) Minimum building life-cycle cost design criteria, II: applications, Journal of Structural Engineering, 127 (3):338-346.