
What does stiffness have to do with strength? Well, engineers may remember learning about composite beam design, column design, or beams with compression reinforcing. Courses that included these topics introduced the “n” Factor. That is the factor that defines the ratio of the moduli of elasticity between materials. It is used in calculations to convert the stiffness of different materials to a common one. This was the foundation for understanding that stiffness plays a role in the distribution of forces in a section.
However, material stiffness, the modulus of elasticity, and cross-sectional area are not the only components that influence the distribution of force flow. Geometric constraints, such as length of members, support conditions, and sectional properties all influence the force flow in a system. In fact, all of structural engineering is dictated one way or another by the ratio of stiffness between components in a structure. Force flow is defined here as the distribution of all internal systems forces, such as axial force, moment, shear, and torsion.
This article discusses two systems in order to explore the influence of stiffness and strength: 1) structural static systems and 2) connections.
Why is this important? Compatibility of deformations of structural components is the foundation of a safe structure. If there is no compatibility between components, they can easily be overstressed and can fail progressively as a result.
Structural Systems
Often, members are connected to carry the same load, although sometimes it may not appear to be the case. In these instances, the load is distributed to the members in proportion to the ratio of their stiffnesses.
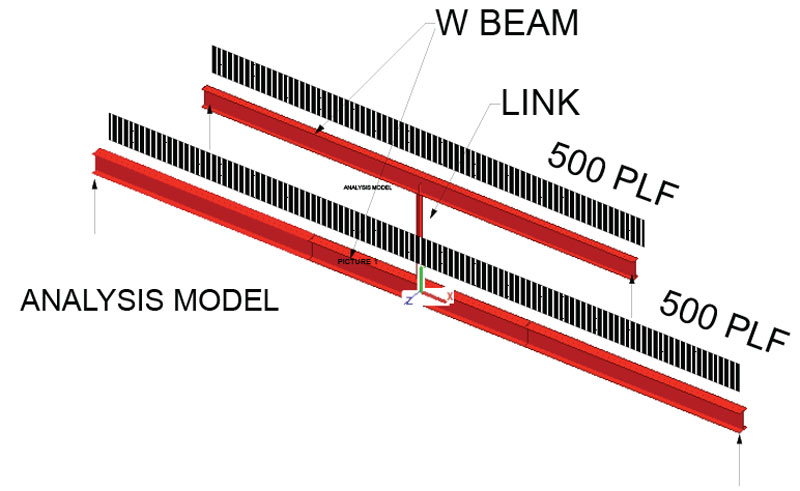
Figure 1. Analytical model – connected beams.
A simple model can demonstrate the interactive effect of members with different stiffnesses (Figure 1). The beams were first sized as independent, unconnected beams based on a linear load of 500 pounds per linear foot (plf). From the resultant moment, a W 10 x 15 was selected for the 20-foot long top beam and a W 10 x 30 was selected for the 30-foot long bottom beam.
When connected, the top beam moment increased by 155% and the bottom beam moment decreased by 33.5%. This disparity is the result of the top beam being significantly stiffer, due to its shorter length, than the bottom beam. It essentially “robbed” the load from the bottom beam. The top beam’s size had to be increased to eliminate the overstress while the bottom beam size remained unchanged. It was necessary for the top beam to be increased to a W 10 x 30 to obtain the strength to carry the increased load that was shed from the bottom beam. Increasing its section results in a larger section modulus and, more so, a larger moment of inertia. Looking at the terms of both, the section modulus and the moment of inertia, one can see that the moment of inertia, and thus the stiffness, increased by a factor of 2.5 while the section modulus increased by 2.3, which is the opposite of what was desired. (Section Modulus S = bd2/6; Moment of Inertia I = bd3/12; b = width, d = depth) (See Figure 2a).
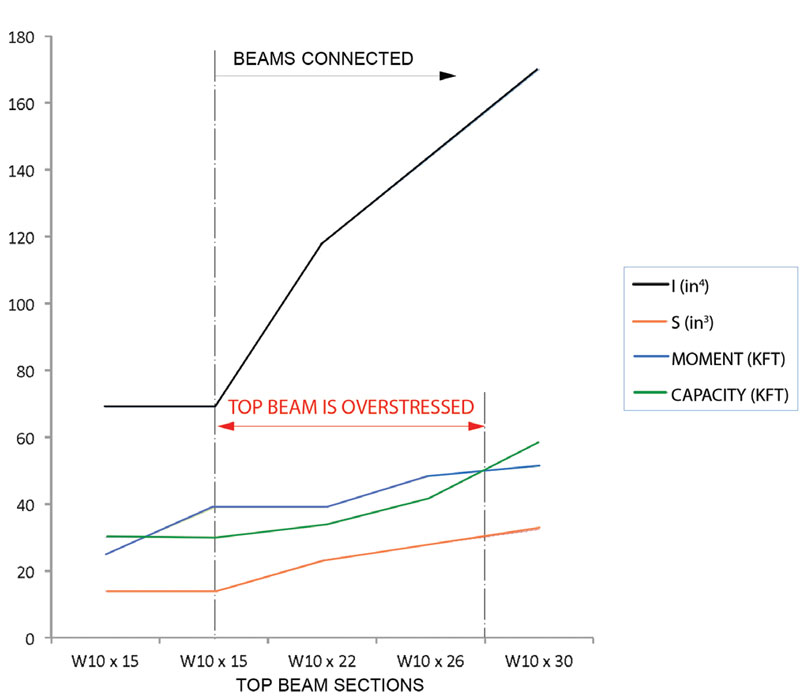
Figure 2a. Impact of top beam size increase.
Another solution would be to increase the stiffness of the bottom beam. In this scenario, the bottom beam is increased to a W 14 x 38 to obtain the stiffness that eliminates the shedding of load to the top beam, while the top beam size remained unchanged. Figure 2b shows the interaction of the two beams. Note that the second solution is more economical. In the first scenario, 300 pounds was added to the structure while the steel weight was increased by only 240 pounds in the second scenario. However, the beam depth increased from 10 inches to 14 inches. The 14-inch deep beam was chosen because the moment of inertia and stiffness increases significantly without a large increase in weight. If the depth could not be more than 10 inches, then the beam size would have had to become a W10 x 68. A third solution would have been to change the boundary condition of the lower beam, i.e. restrain the rotation at the support.
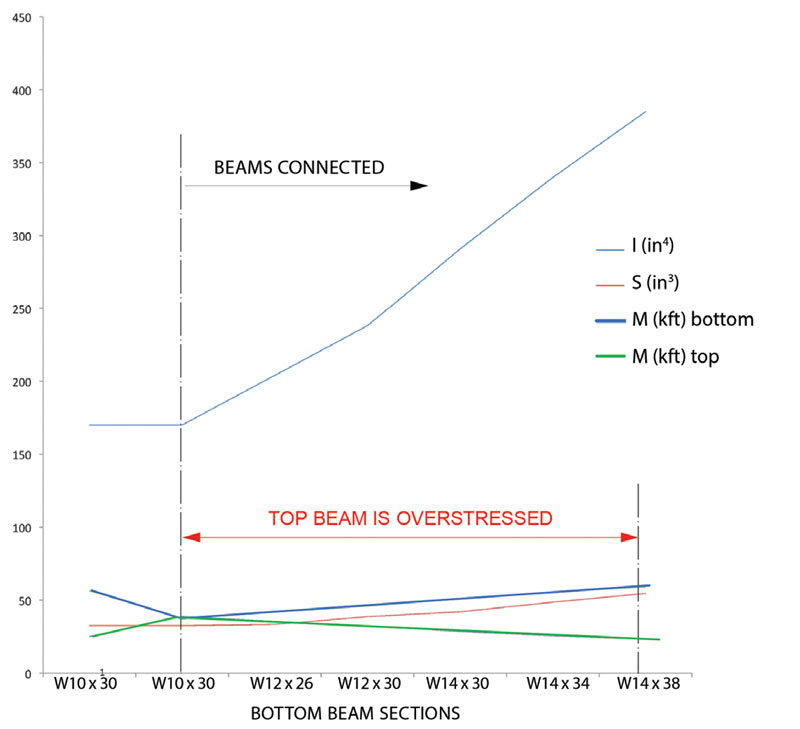
Figure 2b. Impact of bottom beam size increase.
So, where do these conditions occur in practice? They are more widespread than one may realize.
A simple example is a wooden roof structure to form dormers, frequently used in residential buildings (Figure 3). The ridge beam is linked to the valley rafters by the sloped rafters. The roof sheathing is 2 x 6 tongue and groove decking which provides very limited diaphragm action. Often members in these structures are designed based on the contributing load and spans without regard to the fact that they are interconnected. Thus, load sharing is ignored. However, if the structure is analyzed three-dimensionally, which reflects load sharing among the members, it is evident that the assumed load allocation is incorrect and that the ridge member, which was properly sized for the assumed “contributing” load, is overloaded. The behavior is similar to that demonstrated in the example above.
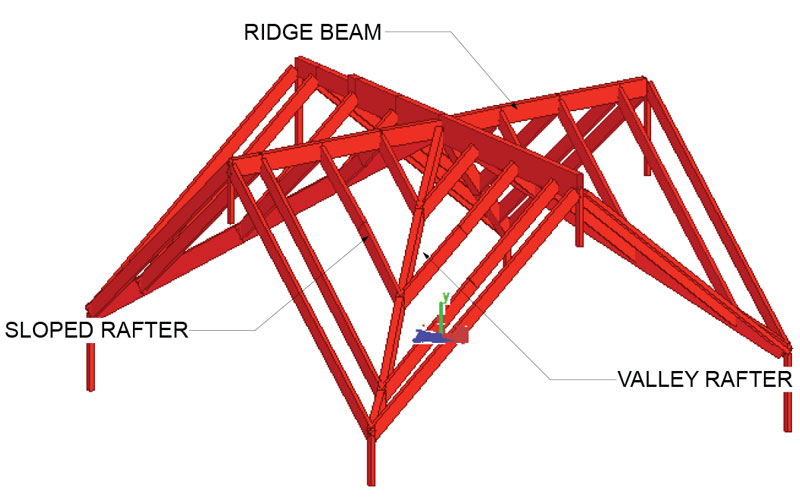
Figure 3. An example of load sharing members in a wood roof.
Again, the reason is that the ridge member is stiffer compared to the valley rafter and attracts a greater share of the total load. Most engineers would increase the ridge member size, usually its depth, because this is more effective in resisting moments. However, what is needed is to modify its stiffness as well as its strength. As shown in the example above (Figures 2a and 2b), the increase in size, specifically the depth, increases the section modulus. At the same time, the moment of inertia is also increased by a larger factor. Increased stiffness attracts even more load, resulting in larger moments.
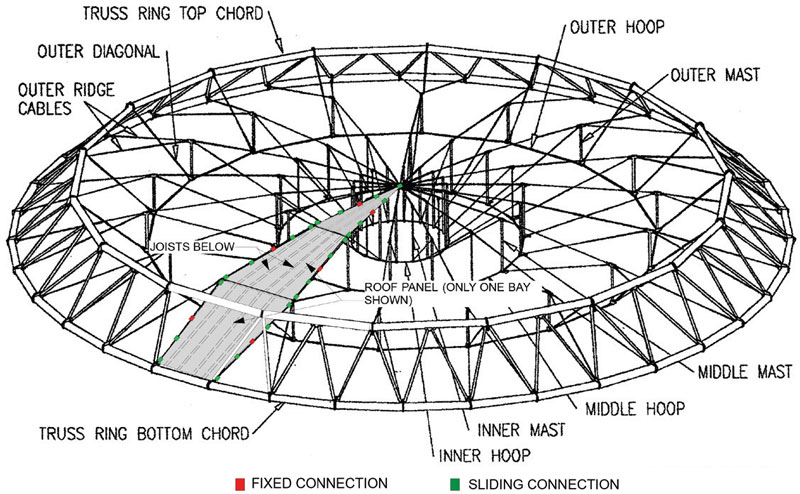
Figure 4. “Floating” roof panels in a cable roof.
Investigating the compatibility of stress and strain, an indicator of material stiffness and cross section, is essential when combining sections of different stress capacities and or stress/strain behavior. An example is a cable roof clad with prefabricated roof panels (Figure 4). The roof panels are composed of joists that support metal roof deck. Edge members around the panels form borders that support the deck on the long sides and the joists on the short sides.
The panels were prefabricated and lifted onto the cable net. The members along the cables are clamped to the cable to prevent the panel from sliding and to resist uplift from wind. The modulus of elasticity (E) of the cable is 20 x 106 kips per square inch (ksi), and its working strength is 90 ksi, with a factor of safety of 2.2. The edge member that is clamped to the cable is a structural section with a modulus of elasticity of 29 x 106 ksi and a working stress 21.7 ksi. If the cable and the edge member are rigidly bolted together, the strain compatibility must be checked. The cables are pre-tensioned to 50% of their allowable capacity before placing the panels. The differential strain between preload and maximum load for the cable is (0.5 x 90)/(20 x 106) = 2.25 x 10⁻⁶ and for the edge member it is 21.7/(29 x 106) = .75×10-6. This means that the strain in the cable under full load is 3 times greater than the allowable strain in the edge member, which would cause failure of the edge member. The solution was to rigidly clamp the edge member of a panel to the cable at only one location and allow the other connections to slide. These additional connections were required to resist wind uplift. The detail for the sliding connection consisted of a split pipe with a neoprene liner between the surface of the cable on the inside face of the pipe. The split pipe was bolted on the cable using “U” bolts.
There are a few structural systems where deformations increase their capacity. In catenary systems, elastic deformations amplify the sag and, thus, its load carrying capacity. Membrane and cable structures often incorporate catenaries.
Connections
The importance of exploring compatibility in connections cannot be overstated. However, detailed free-body analyses of load transfers in connections are often ignored.
An example of connection compatibility is the connection of a cover plate that reinforces a girder. The end connection of a cover plate to the flange of a girder is the critical area because the cover plate strain has to “catch up” with the strain in the girder flange.
The load is transferred from the top flange to the cover plate through welds. The welds provide a shear connection between the two components. Thus, the shear capacity of the weld is critical for the integrity of the connection. Using a free body diagram and looking at the strain compatibility between the connected area of the cover plate and the flange, the weld, as well as the shape of the end of the cover plate, can be determined. The flange is under load and, thus, has deformations. The cover plate needs to adapt to this deformation for a safe load transfer. The limit of how much load can be transferred is defined by the capacity of the welds that connect the plate to the flange. The local stiffness of the cover plate section dictates how much load is attracted. In the design, one can tailor the shape of the end of the cover plate, thereby manipulating the magnitude of load transfer to match the capacity of the welds or match the welds to the stiffness of the cover plate. Here is an example:
A W30 x 132 beam has a moment of 665 kip-feet resulting in a bending stress (fb) of 21 ksi. A ¾-inch-thick cover plate is to be welded to the flange of the beam. The strain resulting from the stress in the beam flange must become the same in the cover plate. The plate is welded to the flange with a
3⁄8-inch fillet weld. The capacity of the weld is 5.6 kips per inch. For welds on both sides of the plate, the load that can be transferred is F = 2 x 5.8 = 11.6 kips per inch. The locally increased area of the cover plate at this location should not exceed A = F/fb;
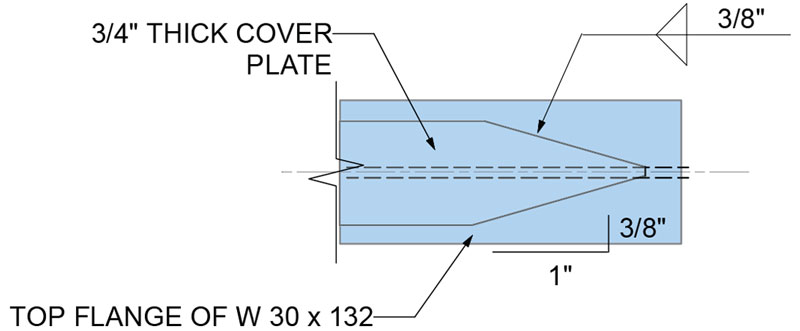
Figure 5. End detail of a cover plate.
A = 11. 6/ 21 = .552 square inches. The stress of the flange is used here because the strain in the cover plate must match the one in the flange. The modulus of elasticity (E) is the same for the flange and the cover plate. Thus, the differential increase of the ¾-inch plate width over 1 inch is .552/ 0.75 = .736. Both sides of the plate edges are tapered in plan. Thus, the taper is 2/.736 or 1: 0.368 or 1 inch: 3⁄8-inch (Figure 5). The magnitude of the total load that is transferred depends on the width of the plate in this example. As more and more load is transferred to the plate, the stress level in the beam flange is reduced and, theoretically, the slope of the taper could be increased. A more practical solution would be to reduce the weld size.
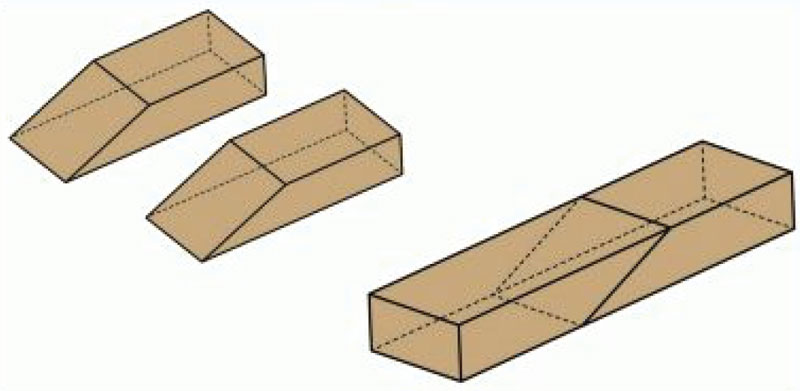
Figure 6. Wooden scarf joint connections.
Scarf splices in wood connections (Figure 6) use the same principal. By tapering the connected section against each other, a smooth load transfer is achieved without overstressing the glue line. They are usually used to extend the length of a member. Failure in these connections usually originates at the apex of the tapered joint. If the glue line fails at this location, the joint “peels” apart. The cause is an increase of stress in the remaining glue line.
Another example of how the stiffness of a component in a connection affects its performance can be shown at a simply-bolted splice of a wide flange beam. The force in one beam is transferred to another beam by splice plates.
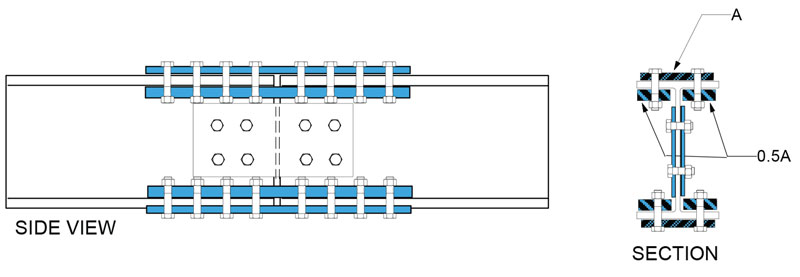
Figure 7. Steel beam splice.
Plates on each side of the web, on the outside of the flanges, and on the underside of the flanges are bolted together to form the connection (Figure 7). The connecting bolts are loaded in double shear. The plates on the outside of the flanges differ from those on the underside of the flange. The width of the outside plates can be the full width of the flanges. The plates on the underside of each flange are placed on each side of the web to clear the web and fillet; thus, the combined width of these plates is less than that of the top plate. The full capacity of a bolt in double shear can only be realized if both bolt shear planes are stressed to their maximum allowable shear stress. This can only happen when the strain of top flange plate is equal to that of the underside. Consequently, the area of the top plate must equal the sum of areas of the “under-the-flange plates.” The total width of the under-the-flange plates is less than that of the top plate due to the interference of the web and fillet. By increasing the thickness of the under-the-flange plates, the same area of that of the top plate can be obtained resulting in an equal strain in the connection plates.
Materials
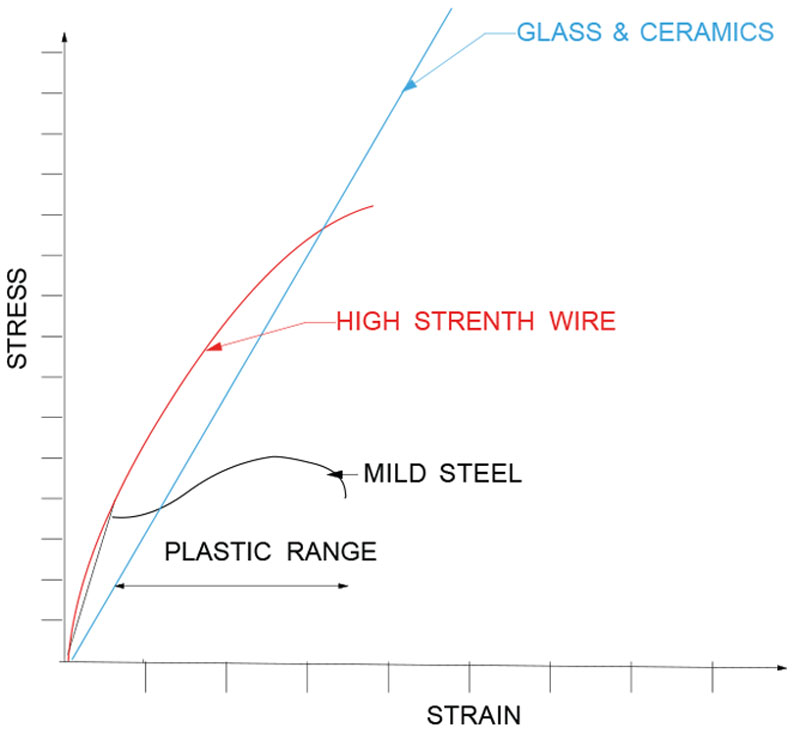
Figure 8. Stress-strain curves for different materials.
All the above examples are based on materials with pure elastic behavior. Elastic behavior means that the stress/strain relationship is linear. Most designs assume that the materials behave linearly, which allows one to readily extrapolate the forces and stresses of a structure or connection. It allows the superposition of load effects. However, most materials exhibit non-linear behavior in higher stress ranges. Figure 8 shows the stress-strain curve for steel, high strength wires, and glass and ceramic materials. Note that mild steel in the plastic range (yield range) deforms but gains very little strength. This results in a loss of stiffness. Consequently, in the yield range, a member can shed load to other stiffer members in a structure that are less stressed and whose material have not yet reached the yield stress. The change in geometry in the system may cause instability in compression members that must be examined. Yielding of the steel, however, is limited by the breaking strength of the material as well as strain hardening. Strain hardening occurs with cycled stresses in the yield range and reduces the ductility of the material.
Fillet welds would not work without yielding since strain compatibility is rarely observed between connected sections. Only in bridge work and when fatigue issues are a concern is strain compatibility addressed.
The pure elastic behavior of a material (without any plasticity at any stress level) is brittle behavior. These materials are unforgiving to overloading, and their failure is without warning. It is for this reason that factors of safety in the order of 4 to 6 are applied in the design of glass and stone, and a factor of safety of 2.2 is applied in the design of high strength cables with a limited inelastic range at high stress. These are all in contrast to mild steel, with a sizable yield range and a factor of safety of only 1.6.
The Final Word
The stiffness distribution in a structural system affects its force flow. By manipulating its stiffness, the force and moment distribution can be rearranged. Components in structures are rarely isolated, even though it is often assumed that they are. Looking at the deformations and strain compatibility between components, one may get a better understanding of the force and moment distributions that may result in a more economical and safer design. There are computer programs that analyze these relationships and more that can incorporate the non-linear behavior of materials. However, finite element analyses of connections often still lead to unrealistic results, because these analyses do not reflect the plasticity of the materials.
The evaluation of strain compatibility in the design of pure elastic materials is essential. Without that, the possibility of sequential or progressive failure is high.▪