
Ground Penetrating Radar Yields Benefits
According to the American Society of Civil Engineers (ASCE), approximately 25 percent of the nation’s bridges remain structurally deficient or functionally obsolete. The 2013 edition of ASCE’s Report Card for America’s Infrastructure warns that more than two hundred million trips are taken daily across deficient bridges in the nation’s largest metropolitan regions. One in nine of the nation’s bridges are rated as structurally deficient, and the average age of the nation’s 607,380 bridges is currently 42 years – many around the country are sixty to eighty years old.
The report states, “The challenge for federal, state, and local governments is to increase bridge investments by $8 billion annually to address the identified $76 billion in needs for deficient bridges across the United States.”
Bridge inspection is of fundamental importance in meeting that challenge. For bridges that were built in the 1960s, which have been deteriorating or been repaired throughout the years, how do responsible authorities prioritize which need to be repaired and which need to be replaced? How do they know which can wait until next year? How do they arrive at appropriate budgets?
The answers lie in understanding and selecting the right combination of bridge inspection tools, which can provide information relative to the condition assessment of the bridge structures.
Range of Bridge Inspection Tools
Inspection methods are usually divided between destructive methods, like coring and chipping, and non-destructive testing (NDT) methods – those that evaluate the properties of a material, component, or system without causing damage.
There is a wide array of bridge inspection tools used around the country. Options can be used alone or in combination. The preferred techniques vary from state to state – and different states tend to have particular biases and preferences. Some states are progressive, using the latest technology or combination of technologies. Many states see the benefits of NDT methods as a way to reduce the amount of work that is required, and as a way of ensuring condition assessment data is most accurate.
Here is a quick overview of the pros and cons of the key inspection techniques engineers have in their toolbox.
Acoustical techniques are typically performed using a chain drag or a hammer, where the human ear discerns changes in the sound or pitch made by the chain or hammer being moved over the surface. The goal is to detect delamination, which refers to the separation of a coating from a substrate or the splitting of a structure into layers. Delamination in bridge decks is caused by the corrosion of reinforcing steel bar (rebar) and/or freezing and thawing. Delamination can often only be detected by nondestructive tests, including hammer sounding or chain dragging.

Figure 1. NDT testing procedure, called hammer sounding, using an acoustical representation to identify areas of delamination.
The advantage of acoustical methods is that they are inexpensive and easy to do with limited training. Typically, the worker will locate areas of deterioration just by the change in tone and will mark the extents of the area with spray paint; the areas are then recorded later by another employee who will take a photograph or lay out a grid to map them. The technique is basically designed to get “real time” answers to delamination locations.
The drawbacks to the method include the fact that it does not work on bridges with asphalt overlays (built-in boundary layer), and that different users may provide different delamination maps due to hearing biases. Outside noise, for example, traffic, can affect the results. It is not possible to get 100 percent repeatable results with different people conducting the inspections. Also, the technique only produces a map of existing delamination, which occurs after the rebar is significantly corroded. Deterioration that has not yet led to delamination is not mapped, rendering the technique inappropriate for planning more proactive repairs.
Half-cell potential – This is a method of assessing rebar corrosion by measuring the voltage between the rebar in the concrete and a reference electrode placed on the surface of the concrete. The advantage of this approach is that it is more sensitive to rebar corrosion than acoustical sounding, so it can detect corrosion before it has progressed to the point where it has caused delamination.
Unfortunately, this method also cannot be performed on bridges with asphalt overlays, as bare concrete is required. In addition, the method requires closing down the bridge deck, which can have a negative effect on traffic. It also requires quite a bit of time to complete, as discrete measurements are obtained on a grid pattern. This method is probably best used when you already know the bridge deck requires repairs, and you are trying to determine where repairs are needed and what kind of repair is necessary. It can help determine if you need to totally remove the deck or do in-place cut and patch repairs.
Infrared – This method relies on changes in infrared radiation from the surface of concrete that are indicative of delamination. The method can be performed quickly and with a moving vehicle, minimizing bridge downtime and maximizing human safety. However, it requires that data be obtained at specific times when there is a large thermal gradient between the bridge temperature and the ambient temperature. Once again, this method cannot be performed on bridges with asphalt overlays.
Visual inspection – This “low tech” method calls for surface mapping cracks, spalling, and potholes on bridge decks that can be seen with the naked eye. It is a straightforward approach that allows inspectors to map areas that are in immediate need of repair. The down side is that it is not possible to obtain a condition assessment of the interior of the concrete. Visual inspection is also the least efficient maintenance method, since it addresses problems only after they have resulted in damage and cost the most to repair. It is analogous to a leaky roof or water pipe – it is best to repair the roof or pipe before the leaking water ruins everything around it.
Ground-penetrating radar (GPR) – GPR uses radar pulses to image the subsurface. This NDT method uses electromagnetic radiation in the microwave band (UHF/VHF frequencies) of the radio spectrum, and detects the reflected signals from subsurface structures. GPR can be used in rock, soil, ice, fresh water, pavements and structures. The reflected signals are used to detect objects, changes in material, voids and cracks. GPR is used for assessing the quality and uniformity of an asphalt or concrete highway surface, and detecting deterioration on bridge decks.
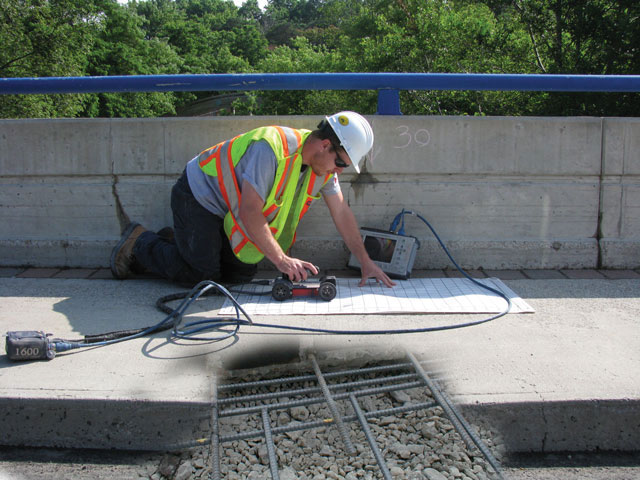
Figure 2. Simplified diagram of how ground penetrating radar technology works.
The two most common types of GPR for bridge surface measurement are ground-coupled and air-launched. Ground-coupled systems rely on an antenna that is placed very close to the roadway/surface while air-launched systems use directional antennas aimed at the surface from a height of 12-20 inches. Ground-coupled antennas have a reputation of being less prone to radio frequency interference (RFI) from cell towers and TV broadcasting, but typically operate at very slow speeds that are below normal highway minimums. Air-launched antennas, even when travelling at 65 mph, are located at a safe distance from the surface.
There are a number of advantages of GPR technology for bridge inspection, and the method is particularly well-suited to prioritizing for budgeting purposes. Whereas acoustical methods are very subjective, GPR data is quantitative. Noise does not affect radar technology.
Coring and chipping – Even if NDT methods are used, a certain amount of coring (drilling a hole to view the concrete and rebar condition) and chipping (actually chip the cover away to be able to view the rebar) may be required to justify the deterioration that was mapped using NDT techniques. Corroborating results of NDT methods with coring/chipping increases confidence levels. Cores can also be obtained to measure the mechanical properties of the concrete – the compressive and shear strength, as well as the chemical properties of the concrete – chloride ion content and presence of alkali-silica reaction (in conjunction with petrographic examination). All this is useful information beyond what the NDT methods provide.
Of course, aside from being destructive, there is a relatively higher cost factor associated with each core, so the goal is to minimize the number of cores required to give the owner assurance that the results are correct.
Using GPR for Bridge Inspection
As noted, GPR can be an excellent tool and is used for condition assessment, concrete cover, and concrete inspection. Typically, a cart-based system is used, in which data is collected at a walking pace (or a vehicle traveling about 5 miles per hour). The equipment will include the antenna and a controller. The radar technology looks for weakness in the returning radar signal from the reinforcing steel; the weaker the signal, the more deteriorated the concrete. The technology can show the location and depth of rebar, tie bars, and dowel bars. Figure 3 shows the system being used in the field on a bridge deck.
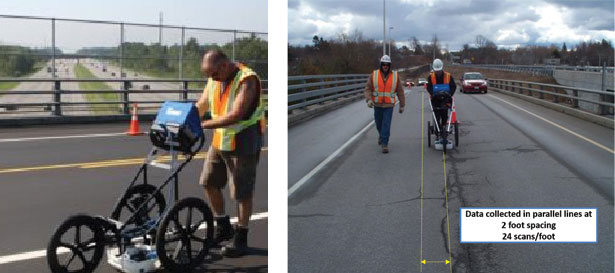
Figure 3. Data collection using GPR.
Condition assessment can be performed using both air-launched horn antennas and ground-coupled antennas. The ground-coupled antennas provide better horizontal resolution, which is sufficient to enable imaging of individual rebar in the top mat, typically not possible with horn antennas. This is one of the major reasons why ground-coupled antennas provide higher quality data than air-launched antennas. Ground-coupled antennas are used to collect densely spaced measurements along lines that are oriented so they cross over the top rebar in the upper mat at right angles (or close to a right angle if the rebar are skewed). The amplitude of the radar wave reflection from each rebar is recorded versus its location on the bridge. Relative changes in the rebar reflection amplitudes are typically indicative of the condition of the rebar and/or the concrete cover above.
For maximum accuracy, rebar reflections arriving from rebar positioned at different depths may need to be corrected, depending on the depth difference. This can be tricky as variation in concrete moisture can lead to the illusion of depth variation. Also, there are rules of thumb for choosing the relative change in rebar reflection, which is indicative of deterioration that requires maintenance. Often the GPR practitioner will map surface defects and map the corrosion evident from staining on the underside of the bridge deck to help fine-tune the deterioration threshold value.
GPR can also be used for quality assurance/quality control (“QA/QC”) of the concrete cover on new bridge decks to determine whether the depth of the rebar meet the proper specifications.
Concrete cover measurements are most often obtained during QA of the bridge deck after it has been poured to ensure the top rebar mat is at the depth range specified in the bridge plans. The measurements involve collecting data with a ground-coupled antenna along one or more profile lines to record the arrival time of the rebar reflections. Then, a core is drilled at one of the rebar locations to measure the rebar depth. This is input into the processing software, which calculates the radar wave velocity. This information is then used to obtain the depths of the rebar.
This is a straightforward procedure that provides a very accurate measure of rebar depth. The user should select a rebar near the beginning or end of the profile line for the calibration core to ensure that the rebar depth can be matched up with the same rebar that generated the reflection detected in the GPR data.
One example of GPR technology used around the country is the BridgeScan™ system, a structured approach to collecting, processing and interpreting GPR data for bridge deck condition assessment, developed by GSSI. The procedure provides a map of rebar reflection amplitudes.
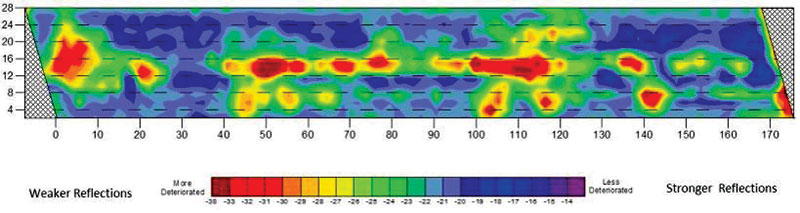
Figure 4. GPR software denoting areas of concrete deterioration.
As shown in Figure 4, the areas with the lowest rebar reflection amplitudes (yellows and reds) correspond to portions of the bridge deck containing the most distress in terms of concrete deterioration and/or rebar corrosion.
ASTM standard D 6087 is used to assess the range of reflection amplitudes that correspond to expected bridge maintenance. Assessment of the maintenance requirements indicated by the GPR data is augmented by visual inspection and other accessory condition information, such as previous maintenance records.
Inspecting the Future
Bridge inspection techniques and equipment have come a long way, and the development of improved GPR technology has enhanced inspection results substantially. GPR is gradually becoming a mainstream application in the toolbox of methods used to evaluate bridge conditions.▪
References
2013 Report Card for America’s Infrastructure, Bridges, American Society of Civil Engineers (ASCE), www.infrastructurereportcard.org/bridges/, retrieved 8/26/2014.
Delamination, American Concrete Institute www.concrete.org/Tools/TroubleshootingSurfaceImperfections/Delamination.aspx, retrieved 8/26/14.
Daniels DJ (ed.) (2004). Ground Penetrating Radar (2nd ed.). Knoval (Institution of Engineering and Technology). pp. 1–4