
Part 1
Concrete buildings with vulnerable columns are some of the most dangerous structures when earthquakes occur. Since the 1970s, building codes have addressed the detailing of columns that are part of moment frames in high-seismic regions. Research for the Portland Cement Association [Blume et al., 1961] and subsequent studies in New Zealand established the need for close spacing of ties and a capacity design of frame members for shear strength sufficient to cause flexural yielding rather than undesirable shear failure.
While these provisions were required for moment frame columns and beams, in the U.S. it took until the 1997 Uniform Building Code (UBC) before such provisions were required for “gravity” columns, i.e., columns categorized by the structural engineer as not part of the seismic-force-resisting system.
Even in countries with a history of advanced seismic codes, concrete buildings have collapsed because of vulnerable gravity columns. This happened in the U.S. in the 1994 Northridge earthquake and New Zealand’s 2010 Christchurch earthquake.
Project Testing
In a recent project at the University of California, San Francisco (UCSF), the retrofit of the seven-story Mount Zion Housing building afforded an opportunity for full-scale laboratory testing of a vulnerable concrete column. In addition to other seismic deficiencies typical of a concrete structure from the 1960s, the building has interior columns that lack a close spacing of ties over most of the column height. The columns are governed by non-ductile shear failure, as assessed by ASCE 41-17, Seismic Evaluation and Retrofit of Existing Buildings.
At most interior columns, fiber-reinforced polymer (FRP) wrap could be applied around the entire column perimeter (i.e., all four faces). This is a typical approach to increasing the shear strength of existing concrete columns. However, interferences at nearly 30% of the interior columns prevented access to one column face, driving the need for a three-sided option. UCSF, the structural engineer of record (SEOR), and the peer reviewers sought input from FRP designers about the potential for a three-sided solution. They agreed that the designer of a three-sided FRP wrap would have to provide testing validation of the structural effectiveness of the retrofit used. The group envisioned FRP wrapping on three sides of the column and FRP through-anchors instead of FRP on the fourth side. A detail of this type had previously been designed and tested by Aegion/Fyfe for pilasters.
The FRP subcontractor for the project selected Simpson Strong-Tie to design and provide the FRP, and Simpson developed a proposed detail and test program to meet the requirements established by the SEOR. The testing program included a control column (i.e., with no FRP) and columns wrapped using the three-sided FRP with FRP through-anchors. This article discusses the results of the control column test. The results of the FRP-strengthened column tests will be discussed in a subsequent article.
Column Testing Program
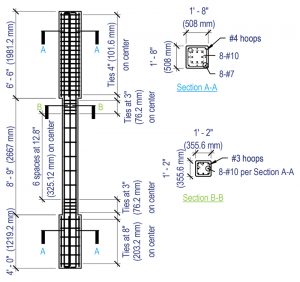
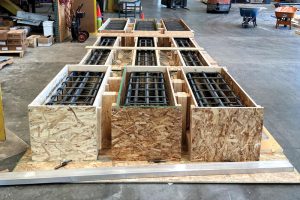
The testing was carried out at Simpson Strong-Tie’s Tyrell Gilb Research Laboratory in Stockton, CA. The testing included one control column specimen, discussed in this article, and two FRP-strengthened columns, discussed in a subsequent article. Figure 1 and Figure 2 show the column design and construction.
Material Properties (Control Column)
From the mill certificates of the reinforcement, the Grade 60 #10 longitudinal bars had fy = 69.4 ksi and fu = 98.8 ksi. The Grade 40 #3 ties had fy = 55.0 ksi and fu = 82.5 ksi during field testing. The concrete strength at the time of testing was 2,568 psi, based on the average results of six cylinder tests taken over three days (i.e., two cylinders before, two after, and two on the day of the control column test).
Test Setup and Procedures
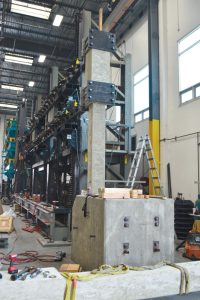
The columns were tested under imposed lateral force and displacement, with fixed-fixed end conditions (Figure 3 and Figure 4). The fixed base is achieved by clamping the lower section of the specimen to a concrete abutment with a steel plate and threaded rods. The abutment is, in turn, anchored to the laboratory’s strong floor.
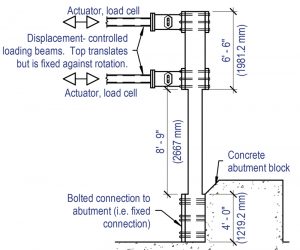
The upper section of the specimen is restrained from rotation by two fixtures that each deliver the lateral load to the specimen from a horizontal servo-hydraulic actuator and horizontal HSS steel tube sections that act as loading struts. The actuators are coordinated and controlled to keep a fixed condition at the top of the column, with the top block of the specimen translating but not rotating.
Each actuator is equipped with a load cell and internal displacement transducer for actuator force and displacement measurements, respectively. Each HSS loading strut has two strain gages installed, one on each vertical face, near the end of the strut adjacent to the test specimen. These strain gages were used to record slight differences between the summation of both actuator load cell readings on the opposite end of the HSS struts and the actual applied load measured via the HSS strain gages on the test specimen end of the HSS struts. The difference in these loads is the friction of the test system (i.e., the friction in the HSS struts sliding over its supports via low friction rails). The friction was also calculated as the difference in actuator load readings at displacement reversal points. Such friction was found to be less than 1% of the applied load.
A cyclic-static history of lateral displacement was applied to the specimens. Axial load was not applied to the column specimen.
Displacement Measurement
The top-of-column displacement measurements are taken from an independent reference frame using a string potentiometer connected one inch below the top of the column clear height. The bottom-of-column displacement measurements are taken from the same independent reference frame using a displacement transducer connected at the bottom of the column clear height. Base slip of the concrete abutment relative to the strong floor is also measured with a displacement transducer. Test results were corrected to remove the small amount of base lateral movement.
All measurements are recorded with a central data acquisition system throughout the duration of each test.
Designing the Control Column
For the test program to succeed, the control (i.e., un-retrofitted) column needed to fail in shear; otherwise, it would not be possible to show that the retrofit solution prevented shear failure. Accordingly, the authors were careful to look at the range of possible best estimates of shear strength and flexural strength to ensure that shear strength would govern for the control column.
Effect of Axial Load
Although many equations for shear strength (such as Equation 22.5.5.1 of ACI 318-14, Building Code Requirements for Structural Concrete and Commentary) have neglected the effect of axial loads, presumably for simplicity, it is well recognized that axial compression increases shear strength. Similarly, axial compression increases flexural strength for columns with an axial load below the balance point, increasing the maximum shear demand under induced displacement. (Maximum shear demand in this configuration equals twice the flexural strength divided by the column clear height, 2M/L.)
Previous research on the shear strength and governing behavior of concrete columns (Kowalsky and Priestley, 2000) concluded that axial compression increases shear strength to a similar extent as it increases flexural strength. Tests of columns having different axial load levels have shown that changing only the axial load does not change the governing behavior mode from shear to flexure or vice-versa.
This observation helped justify testing of the column without the additional variable of superimposed axial load, since the omission of the axial load was unlikely to change the governing behavior mode.
Estimating Shear and Flexure
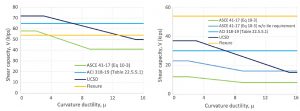
In designing the control column to ensure shear failure, it became evident that, for this column, some methods predicted substantially higher shear strength than the ASCE 41 equations (Sezen and Moehle, 2004) (Figure 5). The method that the authors evaluated that gave the highest shear strength for the column was the modified UCSD method (Priestley et al., 2007).
The most lightly reinforced columns in the building have 4-#7 longitudinal bars. Without axial load, the columns have a flexural capacity corresponding to a shear demand of approximately 24 kips. This just exceeds the ASCE 41 shear strength of 23 kips, making them shear governed by ASCE 41. (The 23 kips includes the Vs contribution of the ties at 12.8-inch spacing; by the letter of ASCE 41, the non-conforming tie spacing means that Vs should be neglected, resulting in an ASCE 41 shear strength of 12 kips.)
However, to have a successful test, the authors wanted to ensure shear failure for the highest predicted shear strength, 39 kips for the UCSD model. To achieve this, and considering the testing uncertainties, the flexural strength was increased to ensure shear demand well above 39 kips.
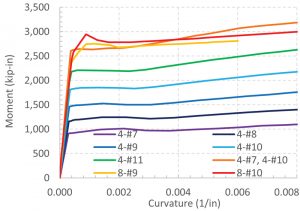
Increasing the reinforcement from 4-#7 to 4-#11 would create a demand (2M/L) of 41 kips, which was judged not high enough. This led to a choice between 8-#9 or 8-#10 longitudinal reinforcement. 8-#10 were chosen to reliably ensure shear failure, creating an expected shear demand of 56 kips (Figure 6 and Figure 7).
While this heavy amount of longitudinal reinforcement did not occur in the Mount Zion Housing building, the authors have seen similar designs with heavy column bars in concrete buildings in California from the 1960s and 1970s, presumably the result of working stress gravity design of the columns coupled with a desire to limit the size of the column section. The heavy amount of reinforcement in the test column would lead to higher flexural compression strain in the concrete and earlier spalling of the cover concrete, but this was expected at deformations sufficiently larger than those at shear failure.
A concrete mix was chosen that was intended not to exceed f´c = 3,000 psi to further avoid increased shear strength. Overall, it was assumed that the column design with heavy longitudinal reinforcement, low concrete strength, and the deficiency of ties would provide a more rigorous test of the effectiveness of the FRP.
Shear Strength Predictions
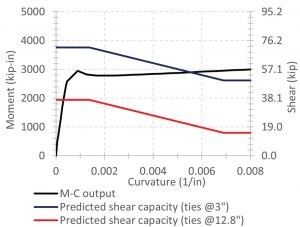
Figure 5 shows the predictions of three shear strength equations compared to the shear demand coming from the column design with 8-#10 longitudinal bars. The UCSD and ASCE 41 models consider the degradation of shear strength with displacement ductility, which applies to the test column only in the end regions where the flexural yielding occurs. The bottom graph of Figure 5 shows that with the high shear demand coming from the high flexural strength, all the equations predict that shear failure in the center region of the column preempts any flexural yielding that would occur in the end regions.
Final Column Specimen Design
The column specimen was the same as an actual column in the following respects:
- Cross-sectional dimensions (14 inches square), concrete cover to ties (1½ inches), and tie size, shape, and detailing (#3 square perimeter ties with 135-degree hooks)
- Column clear height (105 inches)
- Tie spacing at column ends (four spaces at 3 inches o.c.)
The column specimen differed from an actual column in the following respects:
- No axial load other than specimen self-weight
- Tested with fixed-fixed end conditions, eliminating the flexibility of floor structures that exists for the column in the actual structure
- Actual concrete compressive strength for specimen, at time of testing, equal to 2,568 psi compared to specified strength on the existing drawings of 3,750 psi
- Tie spacing over the mid-height region of the column at 12.8 inches (adjusted from the specified 12 inches to avoid adding another tie)
- Longitudinal reinforcement of 8-#10 instead of 4-#7
- Continuous longitudinal bars instead of lap splices
Lap splices were eliminated to avoid complicating the objective of the test because the splices would cause significant congestion with the heavy bars used. Also, the assessment for the original building was that slip or failure of the lap splices would not govern the column behavior. (The authors assessed the lap splices of the building per ASCE 41 and the recommendations of Priestley, Seible, and Calvi, 1996. The splices have ties at 3-inch spacing over most of the splice length.)
Control Column Results
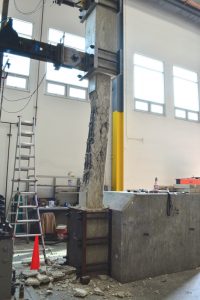
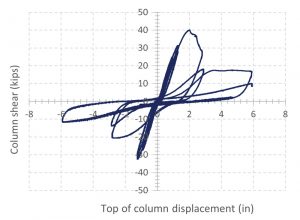
The control column failed in the behavior mode predicted, as desired: shear failure in diagonal tension in the mid-height region of the column, which had a tie spacing of 12.8 inches (Figure 8). The shear failure preempted any flexural yielding of the column. The shear failure did not extend into the column’s end regions, which had a tie spacing of 3 inches. After shear failure, spalling of cover concrete occurred because of the high compression strain resulting from the heavy longitudinal reinforcement.
Degradation of strength after the shear failure was immediate and significant, as shown in Figure 9.
Shear Strength
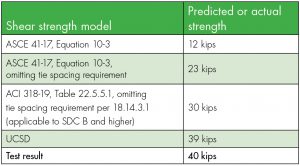
As shown in Table 1, the UCSD model closely predicted the shear strength, while the ASCE 41 and ACI 318 equations under-predicted the strength.
All three shear strength equations correctly predicted the actual behavior mode and its occurrence in the mid-height of the column. This is partly because the specimen was designed to be clearly and reliably governed by shear failure.
Findings and Practical Implications
The testing of the control column shows, for this case, that the UCSD model provides a good prediction of shear strength. The ASCE 41 and ACI 318 equations under-predicted the shear strength, by a factor of three in the case of ASCE 41 (12 kips vs. 40 kips). Therefore, it is worth investigating whether the conservatism in the ASCE 41 and ACI 318 shear strength equations is applicable to other situations and whether it may lead to retrofitting to prevent shear failures that are, in fact, unlikely to occur.
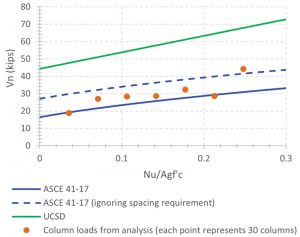
The latter seems to be the case for the Mount Zion Housing building columns, for which shear demand is limited by moderate column flexural strength (4-#7 longitudinal bars are typical for many columns) and by the limited capacity of the floor structure to induce column bending and shear. Figure 10 shows that the building’s interior columns (about 190 total) were retrofitted because they have insufficient shear strength by the ASCE 41 criteria. By the UCSD criteria, they have sufficient shear strength.
Based on the test results for this column and the application of the UCSD model to the properties of the actual building columns, as shown in Figure 10, the columns without retrofitting would have been governed by flexure, with good ductility capacity. Therefore, they would not require the FRP wrapping.
The authors would not have suspected the apparent level of conservatism in the ASCE 41 column shear strength criteria had they not had an opportunity to compare the criteria to a tested column.
It is certainly appropriate to have conservatism in shear strength requirements for concrete columns, given the potential for shear-failing columns to cause building collapse. However, a question worth investigating is whether the ASCE 41 equation is overly conservative. This includes the question of what spacing of tie reinforcement should be considered ineffective in contributing to shear strength.
Part 2 of this article will describe the retrofitting of the Mt. Zion Housing structure and report on the testing of columns retrofitted for shear strength using a three-sided FRP wrap with FRP through-anchors.■
An expanded Table 1 is included in the PDF version of the online article at here.
Project Team
Owner: UCSF
Structural Engineer: Tipping Structural Engineers
Architect: Gelfand Partners Architects
Seismic Peer Review and Structural Plan Check: Maffei Structural Engineering, Estructure, and the UCSF Seismic Review Committee, Consultants to UCSF Building Permit Services
Contractor: Webcor
Subcontractor for FRP: FD Thomas Structural Specialties
Design of FRP and Laboratory Testing: Simpson Strong-Tie
Testing Compliance: TEI
References
Blume, J. A., Newmark, N. M., and Corning, L. H. (1961). Design of multistory reinforced concrete buildings for earthquake motions (5th ed., Vol. 21). Portland Cement Association, Skokie, IL.
Park, R., and Paulay, T. (1975). Reinforced Concrete Structures. John Wiley & Sons. https://doi.org/10.1002/9780470172834
Paulay, T., and Priestley, M. J. N. (1992). Seismic Design of Reinforced Concrete and Masonry Buildings. John Wiley & Sons. https://doi.org/10.1002/9780470172841
ICBO (1997), Uniform Building Code, International Conference of Building Officials, Whittier, CA.
Structural Engineering Institute, American Society of Civil Engineers (2017), ASCE/SEI, 41-17: Seismic evaluation and retrofit of existing buildings, American Society of Civil Engineers, Reston, VA.
Kowalsky, M. J., and Priestley, M. J. N. (2000, May-June). Improved analytical model for shear strength of circular reinforced concrete columns in seismic regions. ACI Structural Journal, 97(3), 388-396.
Priestley, M. J. N., Calvi, G. M., & Kowalsky, M. J. (2007). Displacement-based seismic design of structures. IUSS Press.
Sezen, H., and Moehle, J. P. (2004). Shear strength model for lightly reinforced concrete columns. ACI Structural Journal, 130(11), 1692-1703.
Priestley, M.J., Seible, F. and Calvi, G.M. (1996) Seismic Design and Retrofit of Bridges. John Wiley & Sons, Inc., New York. https://doi.org/10.1002/9780470172858