
Gentle slopes are usually stable. As the slope’s inclination angle increases, the risk of failure increases accordingly. This can be attributed to the instability of the soil mass when the geometry results in the soil strength being unable to provide adequate support and its natural tendency to achieve stability and equilibrium. Failures in slopes usually occur in the form of soil movement, where the unstable mass topples or slides downwards or sideways to achieve stability.
Key Principles
The first step in approaching a slope stability problem is to understand whether there is loading or unloading. Loading problems are typically embankment and reclamation works where the slope is built up from an existing grade and load is added to the soil. Unloading problems occur when soil is excavated from an existing ground such that the load on the soil decreases. Over time, soils tend to get stiffer in loading and weaker in unloading due to pore pressure build-up and the dissipation of the excess pore pressure. The designer needs to consider the type of soil present, groundwater conditions, and soil permeability. For embankment and reclamation, the designer has the advantage of choosing suitable backfills in his design, whereas for excavation, the designer has to consider the soils found on site.
Slope stability problems are a consideration of soil mass stability and satisfying force and moment equilibrium. An inclined mass of soil needs to withstand its own weight, surcharge, and water conditions, either flow or hydrostatic. The soil shear strength along a sliding plane provides the stabilizing force. The failure plane or surfaces need to be assumed, and the corresponding factor of safety (FOS) against sliding evaluated.
Types of slip circles include shallow, deep, and translational. The failure modes must be identified and checked to ascertain the lowest FOS. In design, it is often easy and convenient to choose circular slips for homogenous soils. In non-homogenous soils, the slip surfaces may take on other shapes or geometry. Many ground conditions, in reality, are heterogeneous.
When an unstable mass of soil slides, the sliding surface tends to follow the path of least resistance. If there are any existing faults, fractures, fissures, or weaknesses between or within the soils’ mass or weak soil layers, the failure surface or plane will likely be along these weaknesses.
Analysis and Design
Many slope stability problems are analyzed using finite element methods (FEM) or limit equilibrium methods. Due to the tedious nature of the calculations, software or spreadsheets are often required. Codes generally recommend an appropriate FOS against failure. For example, in the Eurocode 7 design approach 1, there are two combinations to be checked – Combination 1 to factor up the loadings and Combination 2 to factor down the soil strengths.
It is prudent to check the validity of the FEM results. For undrained problems, the designer can refer to Taylor stability charts where a minimum FOS can be obtained based on soil strength and geometry. For drained problems, designers can use the method of slices where a sliding soil mass is divided into small slices to find FOS against sliding by considering force and moment equilibrium. Examples of these methods include Fellenius, Bishop, Spencer, Morgenstern-Price, and Sarma. Each method differs in consideration of the inter-slice forces and the extent of compliance with force and moment equilibrium. Although codes allow such methods to be used in a design, equilibrium must be satisfied, regardless. The drawback to using the method of slices is that it is necessary to test a large number of failure circles with varying centers of rotation; understanding the types of slip circles and making sensible judgments regarding where the potential slip circles might lie is critical.
Designers should also note the differences between a two-dimensional plane strain model commonly used to design and analyze slopes and a real-life three-dimensional problem on site.
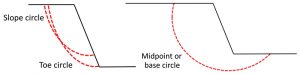
Types of Slip Circles
There are generally two main types of slip circles, as shown in Figure 1. Shallow slip circles are typically slope circles and toe circles where the circles are found above the toe level. A deep slip circle is identified by the circle cutting below the bottom of the slope. In sand, where the relevant type of analysis is drained, the slip circle is shallow. But in clay, using an undrained analysis for the short term, the slip circle is deep. The shear strength of sand comes from its friction angle; the greater the depth, the higher the friction due to the vertical pressure. Thus, the failure surface would not likely go deep, resulting in a shallow slip circle. The undrained shear strength for clay is unaffected by the confining pressure.
Case Study
Taylor’s stability coefficients can be used to find the minimum FOS for the case of a fully saturated clay under undrained conditions (e.g., for a condition immediately after excavation).
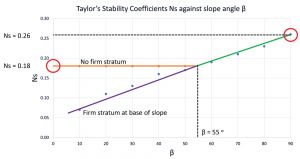
Consider the case of a 45° slope excavated to a depth of H = 26 feet (8 m) in a deep layer of saturated clay of unit weight γ = 122 pcf (19 kN/m3), with the relevant undrained shear strength parameter 1350 psf (cu = 65 kN/m2). The minimum FOS can be found using Taylor’s stability coefficients (Figure 2), where the slope angle, ß = 45°, and, assuming that the depth factor, D, is large (i.e., no firm stratum), the value of Ns is 0.18. The FOS is = cu/(NsγH), = 2.37.
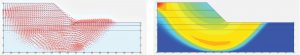
The problem was analyzed using Plaxis FEM software, as shown in Figure 3.
The FOS obtained from FEM is similar to that predicted by Taylor’s stability coefficients. From the deep-seated slip circle, it can be deduced that this soil is undrained. However, the slip circle appears too large to be realistic. The slip circle is limited by the confines of the problem boundary. Enlarging the boundaries does not solve the issue, as the slip circle will simply continue to extend to the edge of the boundary. This problem can occur in an undrained FEM analysis due to the unrealistic assumption of using a constant cu for the entire soil layer. In reality, even for very soft soils, the value of cu increases with depth.
The same problem was re-analyzed using layers of soil such that the undrained shear strength increases with depth, as shown in Figure 4, and a more realistic slip circle is obtained, with a lower FOS.

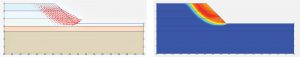
Figure 5 shows a typical drained analysis, where the slip circle cuts the slope above the toe and has a shallow failure zone.
In FEM analysis, it is important to note that, even for drained analysis, c´ is not inputted as zero because zero is prone to numerical errors, being indivisible. Pure sand in a drained analysis is seldom encountered, and most real soils in practice have a small value of c´.
Use of Taylor Chart
Taylor’s stability coefficient, Ns for a homogenous slope in the undrained case, without a firm stratum below the toe of the slope, is 0.18 for slopes up to 55°. Beyond that, Ns increases approximately linearly to 0.26 for a 90° slope. The minimum FOS = cu/(NsγH). For slopes gentler than 55°, the FOS is essentially the same: a ratio of undrained shear strength against a product of soil unit weight and slope height. For a higher slope, the shear strength required to achieve the same FOS is higher. For slopes steeper than 55°, an even more significant increase in shear strength is required due to the increase in Ns. The Ns value of 0.26 for a 90° slope suggests that a vertical cut slope is possible.
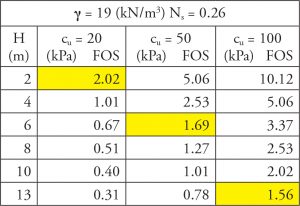
The Table shows FOS for a vertical cut slope with undrained shear strengths of 20 kPa, 50 kPa, and 100 kPa. Values highlighted in yellow correspond to a value above 1.5 (a commonly adopted FOS), and the retained height can be read under the “H” column. Designers need to be cautioned that FOS estimated from Taylor’s stability number are for undrained, homogenous, pure cohesive soils that are optimistic and seldom encountered in practice. A higher FOS should be adopted if one were to rely on these values for preliminary design. Figure 6 shows FEM results for a vertical cut; the failure surface is approximately 45°. This coincides well with the theoretical sliding wedge formulation.
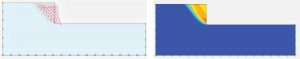
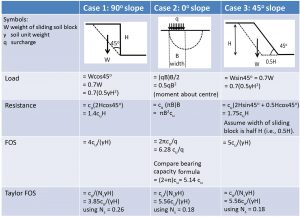
Figure 7 shows three idealized cases of slopes with gradients 90°, 0°, and 45°. Based on geometry and mechanics, the FOS are estimated and compare well against Taylor’s FOS. It can be seen that the slope FOS normalized by cu/(γH) ranges from about 4 to 5.5. Do not be tempted to extend these formulas to drained cases by considering the shear strength of soil to be the sum of cohesion and normal stress multiplied by the tangent of soil friction angle. This does not work. It must be emphasized that these formulas are applicable for undrained cases for cohesive soil where the consideration of groundwater is not applicable, thus allowing calculations to be simplified. Pure sand without cohesion would not stand vertically, and, for sand in its loosest state (minimum density), the angle of slope is the angle of repose.
Translational Slip
For purely frictional sand, a potential failure surface is parallel to the surface of the slope and is known as an infinite slope failure. As the failure surface is shallow, the depth of the slip is small compared with the length of the slope. The FOS for such a case is given by tan φ divided by tan α, where φ and α are the sand friction angle and slope angle, respectively. For pure sand, a slope steeper than the friction angle is likely to be unsafe.
Conclusion
Slopes are often an economic consideration in construction. The safety and stability of slopes depend on many factors such as soil type, loading condition, duration of construction, the permeability of the soil, presence of water, and weaknesses in the ground. When assessing the FOS of slopes, designers should always keep in mind the likely type of slip surfaces that could develop. Taylor stability coefficients and translational slip surface/angle of repose slopes are benchmark cases of an undrained case for clay and a drained case for pure sand, respectively. These are useful aids for the designer to consider when looking at a real-life problem, which is likely to be more complicated.■