
Before the 2016 version of the American Society of Civil Engineer’s ASCE 7 Load Standard, Minimum Design Loads for Buildings and Other Structures, all snowdrifts were two dimensional. The height and width (horizontal extension) of the leeward roof step drifts were taken to be constant all along the roof step. The same holds for windward roof step drifts, parapet wall drifts, and over-the-ridge gable roof drifts. As such, the wind direction of interest was nominally perpendicular to the geometric irregularity, i.e., perpendicular in plan to the roof step, the parapet wall, or the gable roof ridgeline.
There are some roof geometries where two, 2-D drifts overlap or occupy the same roof area. One such roof geometry is the Northwestern corner of a roof with parapet walls along both the North and West edges. Wind out of the South would result in a two-dimensional drift along the North wall, while wind out of the East would result in a two-dimensional drift along the west wall. Presumably, each of the 2-D drifts would control design for most of the bays along the North and West sides, respectively. The 2-D drift footprints overlap at the corner. Prior to ASCE 7-16, the design snowdrift for the NW corner bay was open to question. Some structural engineers may well have designed the bay for each of the 2-D drifts separately. Other structural engineers may have designed the corner bay for the sum of the two 2-D drifts. ASCE 7-16 clarifies the situation by specifying that the snow depth at any point in the overlap area is taken as the larger of the two 2-D drift depths at that point, as shown in Figure 1. That is, a 3-D drift is not a new drift; instead, it is the drift at locations where well established 2-D drifts overlap.
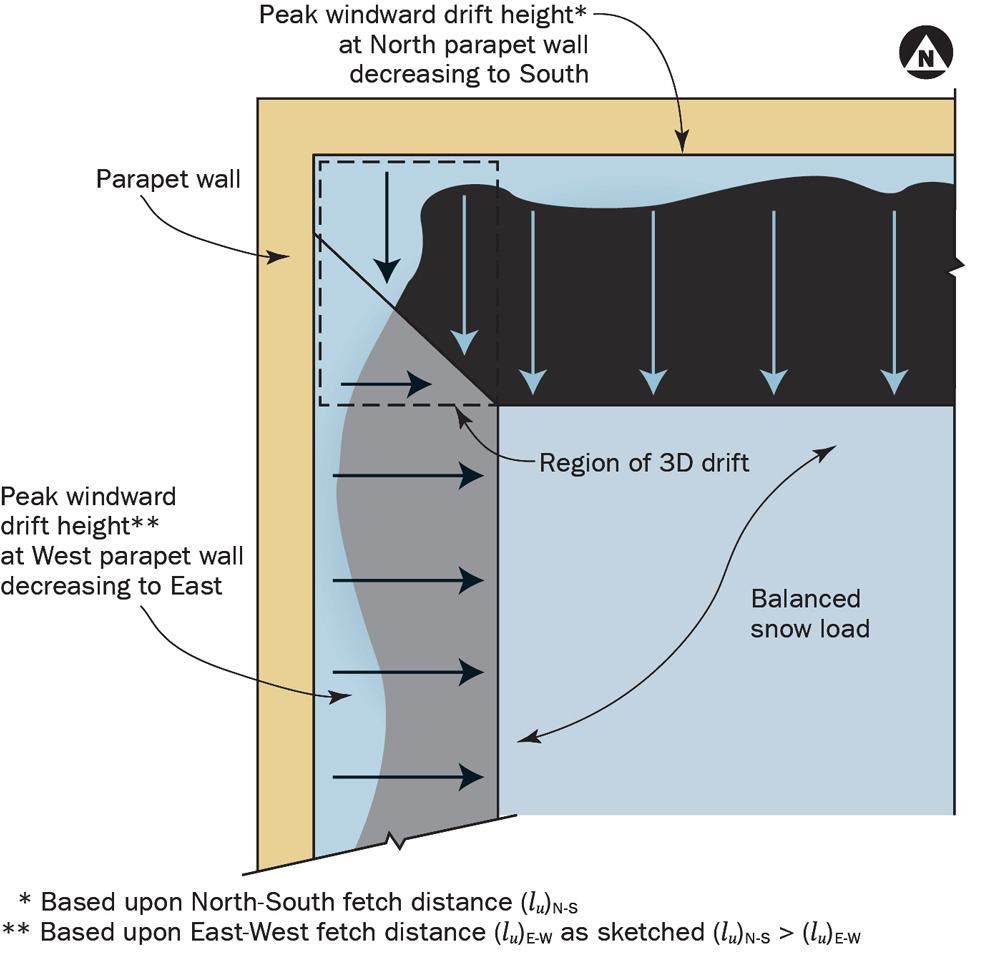
Figure 1. Plan view of a 3-D snowdrift at Northwest corner. The dashed line designates the 3-D drift area.
Note that this approach is consistent with the ASCE 7 approach for roof step drifts. In that case, both the leeward and windward drifts are determined, and the larger (not the sum) is used for design.
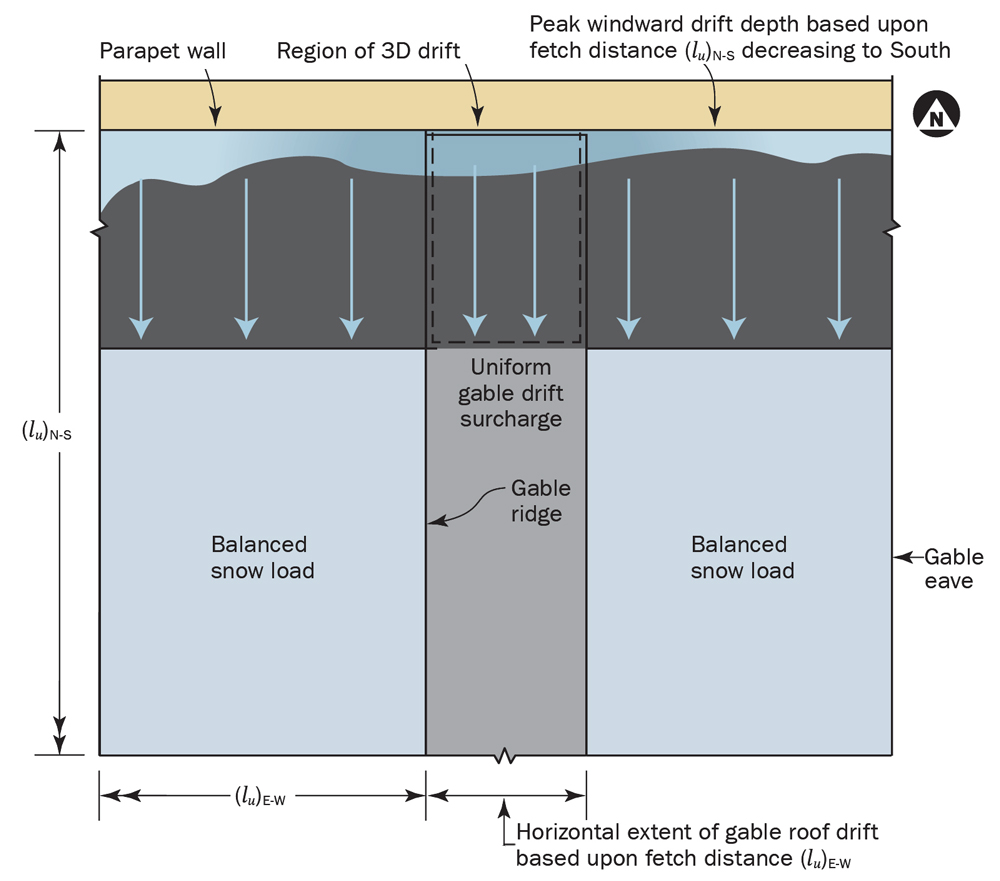
Figure 2. Plan view of 3-D snowdrift for parapet wall at North end wall of gable with N-S ridgeline. The dashed line designates the 3-D drift area.
Other roof geometries can lead to 3-D snowdrifts, i.e., the overlapping of two 2-D drifts. A simple gable roof, with a N-S ridgeline and a pediment or parapet at the North end wall, is one such example. For wind out of the South, there would be a regular 2-D parapet wall drift, while for wind out of the West, there would be a regular 2-D gable roof drift on the East side of the gable. These two, 2-D drifts would overlap along a portion of the parapet wall East of the ridgeline, as sketched in Figure 2. Extension of the current 3-D drift provision for parapet wall corners and re-entrant corners to other roof geometries is currently under consideration by the ASCE 7-22 committee. One issue is whether such new guidance, which by necessity would increase the length and complexity of the code provisions, is needed.
As noted above, there is a single wind direction of interest for the 2-D drifts (e.g., nominally perpendicular to the ridgeline for gable roof drifts). However, there are two wind directions of interest for 3-D drifts (e.g., wind out of South and wind out of the East for the Northwest parapet wall corner case discussed above). This raises the question of the likelihood of multiple wind directions in wintertime. For a site with a single, predominant wind direction (e.g., the winter wind is almost always out of the North), the potential for significant 3-D drift formation would seem limited. On the other hand, 3-D drift formation would seem more likely if winter winds from multiple directions were expected. Boston’s 2014-15 winter season was an example of the latter.
Boston 2015
Boston and other parts of New England experienced significant losses due to a series of four primary snowstorms in January and February of 2015. Based on an insurance arbitration hearing at which the senior author attended as an expert witness, the incurred losses due to eave ice dams alone were more than $100 million. Table 1 presents a summary of snowfall and wind for each of the four Boston 2015 primary storms.
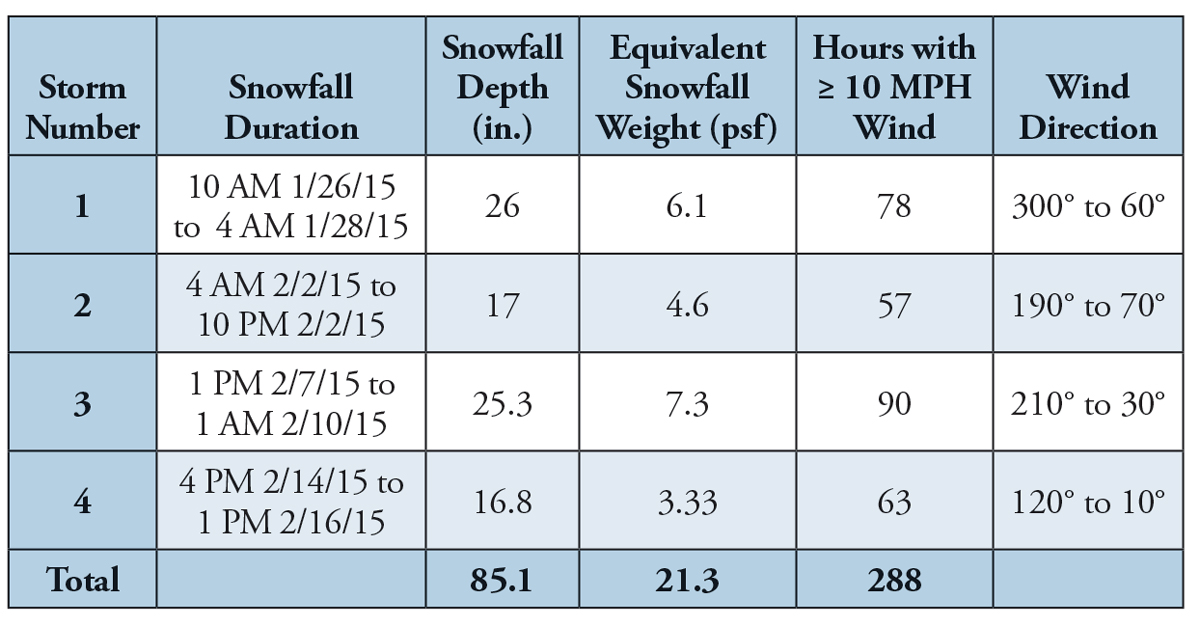
Table 1. Snowfall and wind during winter storms in Boston; January thru February, 2015.
The information in Table 1 is based on National Oceanic and Atmospheric Administration (NOAA) Local Climatological Data Sheets for Logan Airport in Boston. It was assumed that snow remained driftable for 3 days after the end of the storm snowfall (i.e., snow from Storm #1 was driftable until 4 AM 1/31/15)(O’Rourke et al., 2005). Furthermore, the wind speed threshold for snow drifting (i.e., wind-induced snow transport) was taken to be 10 miles per hour (mph)(O’Rourke et al., 2005). Hence, for the 114 hours in Storm #1 from the start of snowfall (10 AM 1/26/15) to assumed cessation of drifting (4 AM 1/31/15), drifting was occurring about 68% of the time, assuming the snow source was not depleted.
The resulting structural damage, in general, and damage to school buildings in particular, triggered deployment of a Federal Emergency Management Agency (FEMA) Building Science Branch assessment team on February 25, 2015. In early March, the FEMA team inspected four partial school collapses – two south of Boston and two in southern New Hampshire. During the FEMA visit, ground snow depth and load samples were taken. The ground snow depths south of Boston ranged from 2.5 to 2.8 feet, and its ground snow loads ranged from 39 to 44 pounds per square foot (psf). The corresponding southern New Hampshire values were 1.4 to 1.7 feet and 22 to 26.5 psf.
Concerning snow drifting, O’Rourke and Cocca (2018) developed parameters to quantify the influence of wind. Specifically, they recommended that the size (cross-sectional area) of the drift surcharge be a function of the ground snow load and the upwind fetch (as is currently), as well as a winter wind parameter. Two wind parameters were considered. The first, W2, is simply the percentage of time during the winter (October through April) during which the wind speed is 10 mph or higher. Note that there is no particular direction associated with W2; all wind directions can contribute. A direction-specific winter wind parameter, W4, was also considered. The parameter was defined as the largest of the eight values for the percentage of time the wind speed was above 10 mph along each of the eight cardinal directions (N, NW, W…NE). By its nature:
W2 = W4N + W4NW + … +W4NE
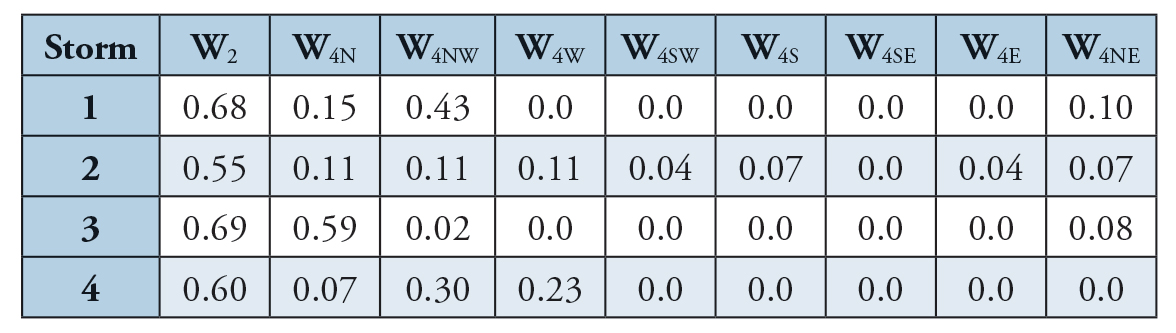
Table 2. Wind parameters W2 and W4 for the four primary Boston 2015 snowstorms.
Table 2 presents the W2 and W4 wind parameters for each of the four primary Boston 2015 storms. For example, during Storm #1, and the three days of potential snow drifting that followed, the wind speed was above 10 mph for 68% of the time, while the wind speed in the north nominal wind direction was above 10 mph for 15% of the time.

Figure 3. Winter wind roses for Boston 2015 storms.
Figure 3, shows the wind rose for each of the four primary Boston 2015 storms. Note that the winds were predominately out of the Northwest and North, respectively, during Storms #1 and #3. Storm #4 had strong winds out of two directions (NW and W), while Storm #2 had three strong wind directions (N, NW, and W).
As noted above, wind out of the North and/or West was common in the Boston 2015 storms. Such a wind pattern, for certain roof geometries, results in the formation of 3-D snowdrifts. As described in more detail in the Snow Study Summary Report: Observations of Snow Load Effects on Four School Buildings in New England (FEMA, 2016), which can be downloaded https://bit.ly/2wYPiUA, two of the four roof collapses were due to 3-D snowdrifts at relatively complex roof geometries. At Mitchell Elementary in Bridgewater, MA, the damaging 3-D drift was due to an overlap of a 2-D gable roof drift due to wind out of the North and a 2-D windward roof step drift due to wind out of the West. Similarly, at Plymouth River Elementary in Hingham, MA, the damaging 3-D drift was due to an overlap of a 2-D leeward roof step drift due to a North wind and a 2-D windward roof step drift due to a West wind. The two partial collapses observed in Southern New Hampshire were both regular 2-D drifts at simpler, less complex roof geometries.
The Boston 2015 wind roses in Figure 3 demonstrated that a shift in wind direction throughout a single snowstorm or over the course of a single winter is possible. The single storm version is common enough that it has been given a name: a Nor’easter. The classic Nor’easter corresponds to a low-pressure system proceeding up the Atlantic coast. In New England, due to the counter-clockwise rotation about a low, there is wind out of the East when the low is south of New York City, followed by wind out of the North when the low is East of Boston. Note that the Boston 2015 wind roses (wind out of the North and West) were not due to a Nor’easter (wind out of the North and East). The Boston 2015 Storm #2 was consistent with a Canadian low traveling along a Southeastern path, somewhat North of Boston.
The classic Nor’easter and at least one of the Boston 2015 storms established that 90° wind shifts are relatively common in New England. However, this does not establish that such wind shifts are common in other parts of the United States.
Winter Wind Shift in the U.S.
As shown above, a wind rose is a convenient way of characterizing wind direction. Figure 4, presents a multiyear rose for Boston, MA. Unlike the individual storm wind roses in Figure 3, the multiyear wind rose in Figure 4 is for 65 winters (October through April). Also, the wind rose in Figure 4 was not restricted to time during and after snowstorms. The multiyear winter wind rose for Boston shows the NW wind was the most common winter direction with W4 = 0.19, and the West wind with W4 = 0.16 was the next most common.
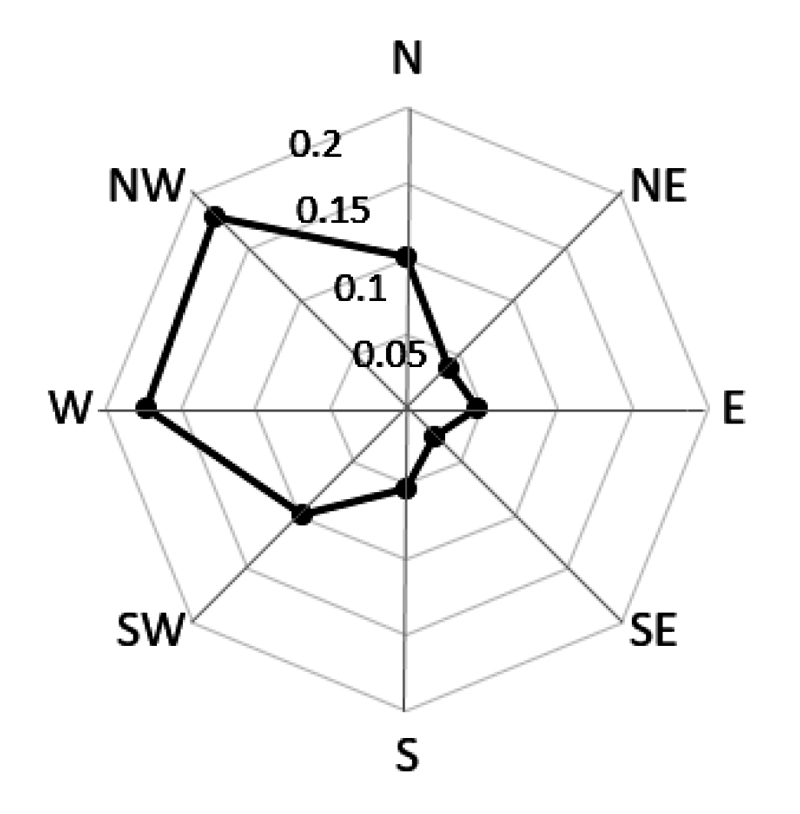
Figure 4. 65-year winter wind rose for Boston, MA.
To use multiyear wind roses for locations across the United States, and to quantify the directional variability of the above-the-drifting-threshold-wind, the multiyear wind roses needed to be rotated and normalized. Specifically, each of the multiyear wind roses was rotated so that the predominant snow drifting wind direction (direction of the largest of the 8 multiyear W4 values) was vertical. For Boston, with NW as the predominant direction, the rose was rotated 45° clock-wise (NW direction now “vertical”). All 272 of the multiyear wind roses were then normalized by dividing each of the eight W4 values by the largest for that location. As a result, each of the 272 multiyear wind roses had an amplitude of 1.0 along the vertical, and smaller amounts for all other directions.

Table 3. W4 values for 272 rotated and normalized wind roses.
Table 3 presents the mean, median, minimum, maximum, and standard deviation of the W4 ratios for all possible wind shifts. That is, 90° CW means 90° clockwise from the predominant direction. Notice that the maximum ratio is close to 100% for all wind directions. That is, there were at least one of the 272 locations where W4 for the next most common wind direction was nominally the same as for the predominant or most common direction. Similarly, the minimum ratio was close to 0% for all directions. That is, for at least one of the 272 locations, there was nominally no snowdrift for some direction other than the predominant direction.
Given the rectilinear nature of most roof geometries, it would seem that a 90° or 270° wind shift from the predominant direction are the two directions of most interest with 3-D drift formation. Assuming a normal distribution, the mean plus 1.5 standard deviations would account for about 93% of the locations. The W4 value for either 90° or 270° CW from the predominate would be (using 0.23 as an average standard deviation for 90° CW and 270° CW)
(W4)270° = (W4)90° = 0.279 + 1.5(0.23) = 0.62
It turns out that the drift height is, as a first approximation, proportional to the winter wind parameter. As such, one could argue that at roof areas where the two 2-D drifts overlap, using the larger of 100% of one of the 2-D drift and 60% of the other 2-D drifts is justified.
Conclusion and Recommendation
The 2015 Boston case demonstrates that strong winds (capable of causing snow drifting) can change direction during a single storm and over the course of a single winter. The 2015 Boston Winter resulted in 3-D drifts (strong winds from directions 90° apart), which caused partial structural collapses and, in one case, complete closure at one school until the summer.
Analysis of winter wind across the whole United States indicates that 3-D drifts are not a “Boston-only” phenomenon. Specifically, the analysis shows that a 3-D drift, composed of or based upon 100% of one of the 2-D drifts and about 60% of the others, seems justified.
It is the author’s opinion that, if the current ASCE 7-16 approach for parapet wall corners is expanded to cover other 3-D drift susceptible roof areas, the 100%/100% approach should be used as opposed to the 100%/60% approach mentioned above. This opinion is based on the following reasoning:
- The 100%/100% approach is consistent with the current ASCE 7-16 approach for corners (parapet wall and re-entrant) and the long-standing approach for leeward and windward roof step drifts.
- The 100%/100% approach is easier to use and understand. The 100%/100% approach requires the structural engineer to determine two 2-D drifts and to consider one combination. The 100%/60% approach requires determination of four 2-D drifts (a 100% and a 60% for both directions) and consideration of two combinations (“100%/60%” and “60%/100%).
- One expects that the number of bays susceptible to 3-D drift formation is small in comparison to the number susceptible to 2-D drift formation. In such situations, “simple and conservative” makes more sense than “complex but precise.”
Examples of the evaluation of 3-D snow drift using provisions currently in ASCE 7-16 or expected in ASCE 7-22 (i.e., the 100%/100% approach discussed above) are presented in a FEMA guidance document Three-Dimensional Roof Snowdrifts Design Guide (FEMA, 2019), available at https://bit.ly/2VCqMmt.■
References
“Analytical Simulation of Snow Drifting Loading,” J. Structural Engineering, ASCE Vol. 131, No. 4, April 2005, (with A. DeGaetano and J. Tokarczyk).
“Improved Snow Drift Rleations” J. Structural Engrg. May 2019 DOI: 10:1061/(ASCE) St. 1943-541X 0002278, 04019027-1 to 04019027-5 (with J. Cocca)