
Cast-in-place (CIP) concrete bridge decks are typically reinforced with steel. However, poor durability resulting from steel corrosion has resulted in the use of alternative noncorrosive reinforcement materials. As part of this effort, glass fiber reinforcement polymer (GFRP) reinforcement bars have been used as structural reinforcement for CIP concrete bridge decks. GFRP is a noncorrosive composite material made of glass reinforcing fibers and a vinyl ester resin matrix. In axial tension, GFRP is elastic with brittle rupture at ultimate. Relative to grade 60 steel reinforcement, GFRP tensile strength is about 150%, the elastic modulus is about 20%, and the unit weight is about 25%. Thus, given the material’s high strength and low stiffness, serviceability of GFRP reinforced bridge decks will be an important consideration in design.
Structural design of bridge decks reinforced with steel or GFRP is accomplished using either the traditional method or empirical method. With the traditional method, the deck is modeled as a continuous beam in flexure, and wheel loads are distributed over an imaginary equivalent strip. Using this simplified flexural model, design moments are found using established methods of indeterminate analysis. The empirical method recognizes that wheel loads are not resisted by flexure, as is assumed by the traditional method, but rather wheel loads are primarily distributed to supporting girders by compression membrane action in the concrete. Consequently, only minimum reinforcement ratios are specified for the top and bottom mats for the purpose of crack control and to resist a small flexural component resulting from the wheel load.
For steel reinforced bridge decks in the US, both traditional and empirical design methodologies are specified in AASHTO 2010 (LRDF Bridge Design Specifications). For bridge decks reinforced with GFRP, AASHTO 2009 (LRFD Bridge Design Guide Specification for GFRP-Reinforced Concrete Bridge Decks and Traffic Railings) specifies procedures using the traditional method, and the Canadian Standard Association 2006 (Canadian Bridge Design Code) provides procedures using both traditional and empirical design methodologies. Using the traditional design methodology as specified in AASHTO 2009, GFRP reinforcement is provided to satisfy design requirements at the Strength, Service, and Fatigue and Creep Rupture limit states.
GFRP has been successfully used as reinforcement in many in-service bridge decks in the US and Canada, including the Val Alain Bridge, Miles Road Bridge, Wotton Bridge, Magog Bridge, Morristown Bridge, Route 668 Bridge, and Cookshire-Eaton Bridge, to name a few. In general, design of these GFRP reinforced bridge decks was performed using the traditional method. The corresponding required GFRP reinforcement was controlled by serviceability limits calculated using elastic analysis at the service limit state. However, concrete and GFRP strains measured during controlled load testing of these bridges have been shown to be only a small fraction of the material’s ultimate strength, and well below the predicted magnitudes calculated based on a cracked section elastic analysis. Thus, where serviceability limits control design, the analytical model used for calculation may not accurately represent the actual behavior of the physical system. Consequently, economy may be compromised by unnecessary cost associated with excessive GFRP requirements made necessary by design calculation.
In the current research study, crack width, deflection and material strain measured at the service limit state are investigated after fatigue loading a full scale GFRP reinforced bridge deck. The bridge deck is reinforced with GFRP as required by design using both the traditional and empirical design methodologies. Measured data is compared to AASHTO 2009 allowable limits to establish performance compliance.
Experimental Program
The experimental program included fatigue loading of a full-scale bridge deck reinforced with GFRP rebar. As shown in Figure 1, the deck is 8 inches thick, supported by four AASHTO Type II girders spaced at 9 feet, has a fascia overhang of 3 feet 3 inches, and is 8 feet in the longitudinal direction. The 8-foot longitudinal width was selected so the deck would be wider than the equivalent strip used in the traditional design method. A 3-inch haunch with GFRP dowel reinforcement between the deck and girder was used as well. The supporting AASHTO girders are non-prestressed, cast-in-place, and in continuous contact with the laboratory strong floor. The experimental parameter is design methodology; with the north half designed by the empirical method (EM), and the south side designed by the traditional method (TR). The reinforcement schedule is provided as a table in Figure 1, where it is noted that the total GFRP reinforcement on the EM side (ρ = 0.023) is 38% less than that on the TR side (ρ = 0.037). The GFRP rebar was provided by Hughes Brothers of Seward, Nebraska. The deck concrete was a PennDOT approved high performance concrete (HPC) mixture used in bridge decks with a target 28 day compressive strength of 4 ksi. Extensive electronic instrumentation was used for deflection, concrete strain, crack width, and force measurement.
Figure 1: Sample details.
A simulated truck axle, consisting of two wheels separated transversely by 6 feet, was used to load the deck. The load portal, hydraulic actuator, and axle beam are shown in Figure 2. The deck was subjected to four load cases, corresponding to the truck axle positioned for critical positive and negative bending moments on both the north (EM) and south (TR) sides (Figure 1). The load case designation is given as MP or MN for critical positive and negative bending, respectively, and -EM or -TR for empirical and traditional design methodology, respectively. Thus, MP-TR represents the load case for positive bending on the traditional design side. For each load case, the deck was chronologically subjected to 100 cycles at 125% of service load (80 kips), 10 cycles at service load (64 kips), 1,000,000 cycles at the fatigue limit state load (36 kips), and finally 10 cycles again at service load (64 kips). The initial overload cycles at 125% of service were intended to crack the deck to a steady state stiffness condition. In this way, the effects of fatigue loading are determined by comparing the 10 service load cycles applied before and after the 1 million fatigue load cycles.
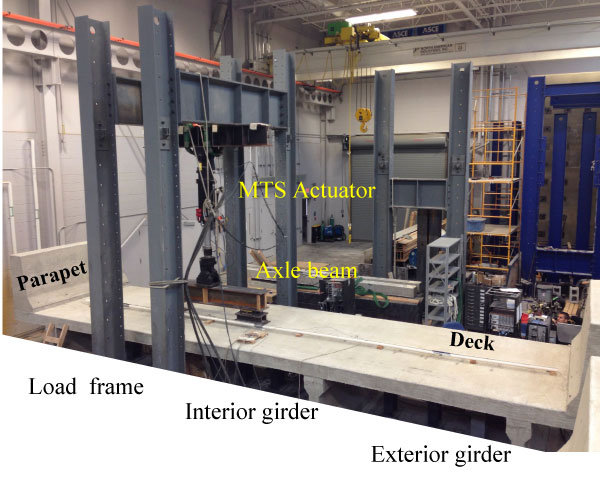
Figure 2: Deck with loading apparatus (MN-TR load case shown).
Test Results
During the overload phase of testing, a crack developed on the top fiber over the interior girder for both negative bending load cases (MN-TR and MN-EM), and for both positive bending load cases (MP-TR and MP-EM) a crack developed on the bottom fiber under the exterior bay wheel load. All four cracks were visible along the entire 8-foot longitudinal width of the deck. No significant additional cracking was visually detected for the remainder of testing.
Recorded behavior for the 10 service load cycles applied after the completion of fatigue loading is presented in Figure 3 in the form of critical crack width, deflection and concrete strain from all sensors and for each design methodology (TR and EM). The residual from all previous load cycles in the load history is included as the offset seen in the figure. In Figure 3 the 100% and 50% allowable limits are shown to provide a reference for degree of compliance. Allowable limits are taken from AASHTO 2009, as 0.02 inches for crack width, L/1000 or 0.108 inches for deflection, and 600 microstrain, corresponding to 0.45f’c/Ec for concrete strain. Note: in determining the concrete strain limit, the deck concrete strength of 5,800 psi was used and Ec was empirically determined by the ACI procedure.
Figure 3: Test results at the end of fatigue loading.
The results of Figure 3 are very encouraging as related to compliance with all allowable serviceability limits. For crack width, the maximum value for traditional design occurred for the negative bending load case and was only 24% of allowable (trace MN-TR in Figure 3a). For empirical design, the maximum crack width also occurred for the negative bending load case and was 41% of allowable (trace MN-EM in Figure 3a). Thus, empirical design is critical over traditional design, as would be expected considering the top transverse reinforcement on the empirical side is only 33% of that on the traditional side (reinforcement schedule Figure 1). Regardless, the empirical side crack width was well within the allowable limit.
For deflection, the positive bending load case was critical for both traditional (MP-TR) and empirical designs (MP-EM). From Figure 3b, the traditional design deflection is 49% of allowable, and the empirical design deflection is only slightly higher at 53% of allowable. From the reinforcement schedule of Figure 1 it is noted that both sides (TR and EM) have the same bottom transverse reinforcement; therefore, the measured traditional and empirical deflections would be expected to be approximately the same. Relative to allowable, deflection is slightly more critical than crack width, but still well below the allowable limit.
Concrete strain results in Figure 3c show positive bending is critical for traditional design (MP-TR) and negative bending is critical for empirical design (MN-EM). Relative to the allowable strain limit of 600 µε, MP-TR and MN-EM are only 30% and 44%, respectively. Thus, the performance of the deck as related to allowable concrete stress of 0.45f’c is very good, with traditional slightly better than empirical.
Conclusions
The results presented evaluate the behavior of a full scale GFRP reinforced bridge deck designed using both empirical methodology and traditional methodology. The deck was initially loaded to 125% of service limit state for 100 cycles, followed by 1,000,000 load cycles at the fatigue limit state, followed by 10 cycles at the service limit state. Critical measurements for crack width, deflection and concrete strain were captured for each of the four different load cases corresponding to critical positive and negative bending for each empirical and traditional design. Measured responses were compared to allowable limits required by AASHTO 2009. Test results show that both empirical and traditional designs are compliant with all serviceability limits. Measured crack widths for traditional and empirical designs were 24% and 41% of allowable, respectively. For concrete stress, these percentages were 30% and 44%, respectively, and for deflection 49% and 53%, respectively. Thus, the critical measured behavior was deflection on the empirical design side, and this was only 53% of allowable.▪
Acknowledgments
The authors wish to thank lead sponsor AECOM and co-sponsor McCormick Taylor for providing financial support. Also, Hughes Brothers is acknowledged for their generous donation of the GFRP rebar.