
Structural Engineering Engagement and Equity (SE3) Committee Survey Results
In Part 1 of this series (STRUCTURE, April 2017), the results of the 2016 SE3 Study focused on overall career satisfaction, development, and advancement. This article highlights survey findings regarding compensation, overtime, and the gender pay gap. A full report that includes findings on work-life balance, flexibility benefits, and caregiving can be found at SE3project.org/full-report.
Compensation
Respondents overall indicated that pay and compensation were the top reasons that they had considered leaving the structural engineering profession or leading reasons why they had left the profession. When asked to rate their satisfaction with pay/compensation, 20% of the respondents reported being “unsatisfied” or “very unsatisfied.”
The average income of all respondents currently practicing structural engineering is $106,800 per year. Pay data were received from 1,955 respondents. Because nearly half of the respondents were from California, where the cost of living is higher than in most other parts of the country, income data for this group is noted separately. The average income of all of the respondents from California is $117,600 per year.
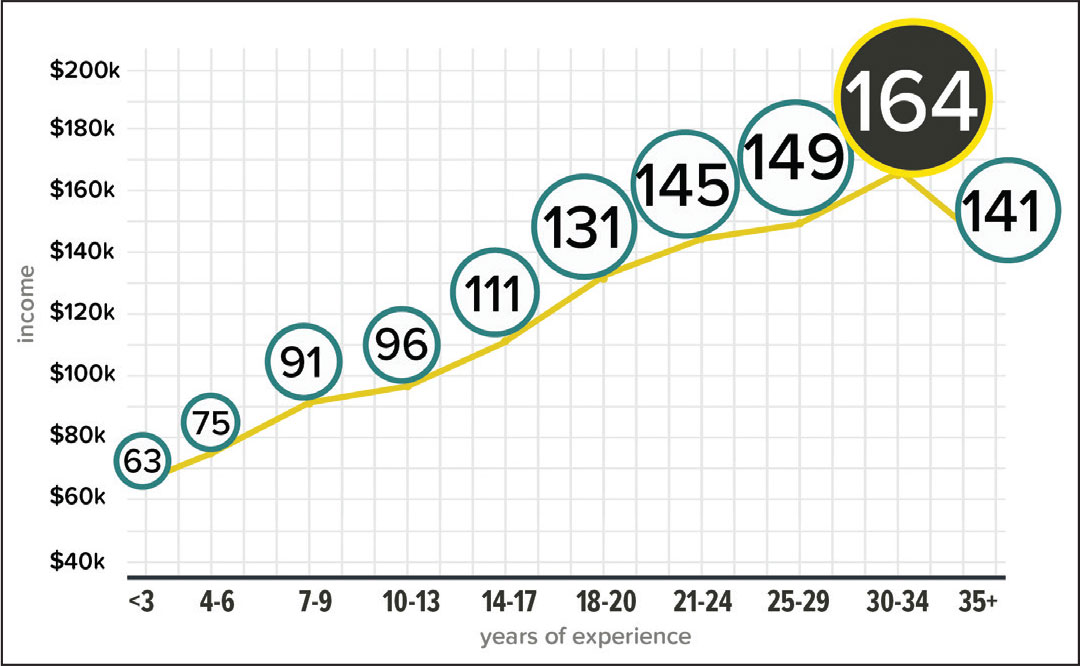
Figure 1. Average income vs. years of experience (all respondents).
As a snapshot of income during the careers of respondents, the average income of a structural engineer with five years of experience is $78,900 per year (in California, the average is $89,000). The average income of a structural engineer with 15 years of experience is $110,600 per year (in California, the average is $118,700). Pay data of the survey respondents is also shown in Figures 1 and 2. For this survey, “income” is defined as gross annual income, including bonuses. Note that the data includes part-time employees who work fewer than 40 hours per week, which accounted for 110 respondents (6%).
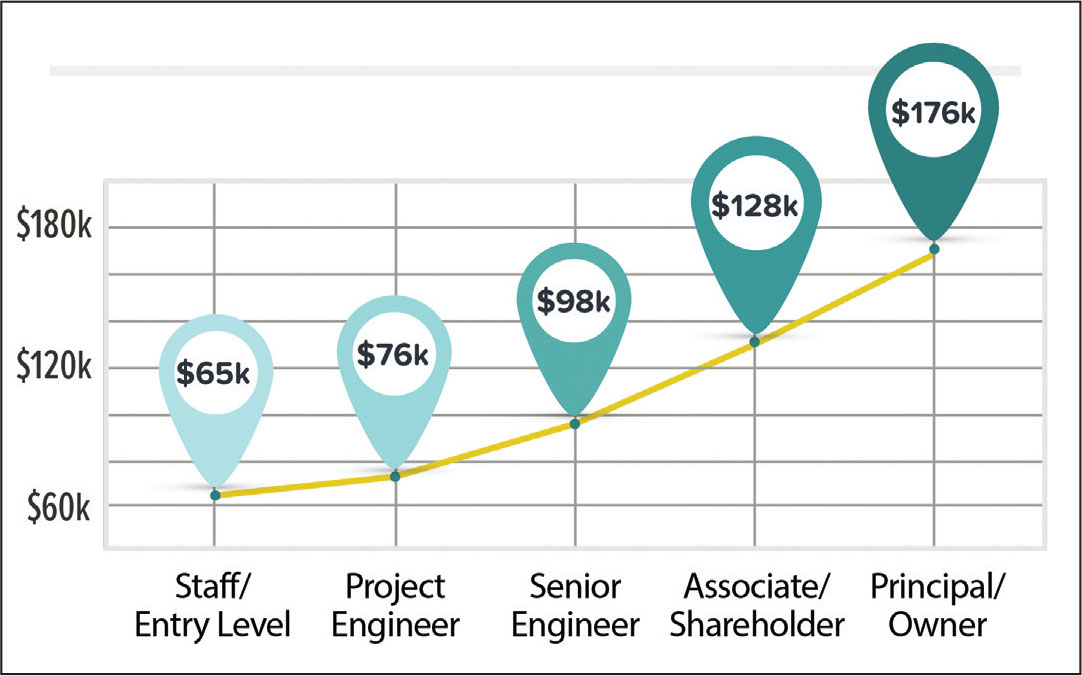
Figure 2. Average income by position title.
Considering only full-time employees residing in metropolitan cities, respondents in California reported income 21% higher than those living outside California. However, when income is normalized to cost of living data (as reported by the Council for Community and Economic Research, http://coli.org), respondents in California make 7% less than those outside California.
For comparison, nationwide data, collected by the U.S. Bureau of Labor Statistics (BLS) in 2015, show that the mean annual wage for a civil engineer in the “architecture, engineering, and related services” category was $88,820 (in California, the mean annual wage was $100,980) (BLS, 2016b). The BLS calculates “annual wages” by multiplying the hourly mean wage by a “year-round, full-time” figure of 2,080 hours. For those occupations where there is not an hourly wage published, the annual wage is directly calculated from the reported survey data. The BLS does not report information on structural engineers specifically.
In comparison with the average income of all practicing survey respondents to the “mean annual wages” reported by the BLS, SE3 survey respondents reported approximately 20% higher income than the BLS data, some of which is likely due to the inclusion of bonuses in the SE3 survey responses. Additionally, SE3 data may be more highly weighted by California responses than BLS data.
A 2013 Structural Engineering Institute (SEI) survey reported the average salary of respondents to be $85,500 per year, based on 728 responses from throughout the United States (Leong et al., 2013). This average salary also excluded bonuses and is therefore noted to be a similar finding to BLS data, especially considering inflation.
Hours Worked and Overtime
Employees who work extra hours are more likely to consider leaving the profession. For each additional hour worked per week over 40, the odds of an employee considering leaving the profession were found to be 4% higher. This points to a tendency for people to “burn out” when their workload is consistently over 40 hours per week. Additionally, satisfaction with pay and benefits was found to decrease as the number of hours worked each week increased.
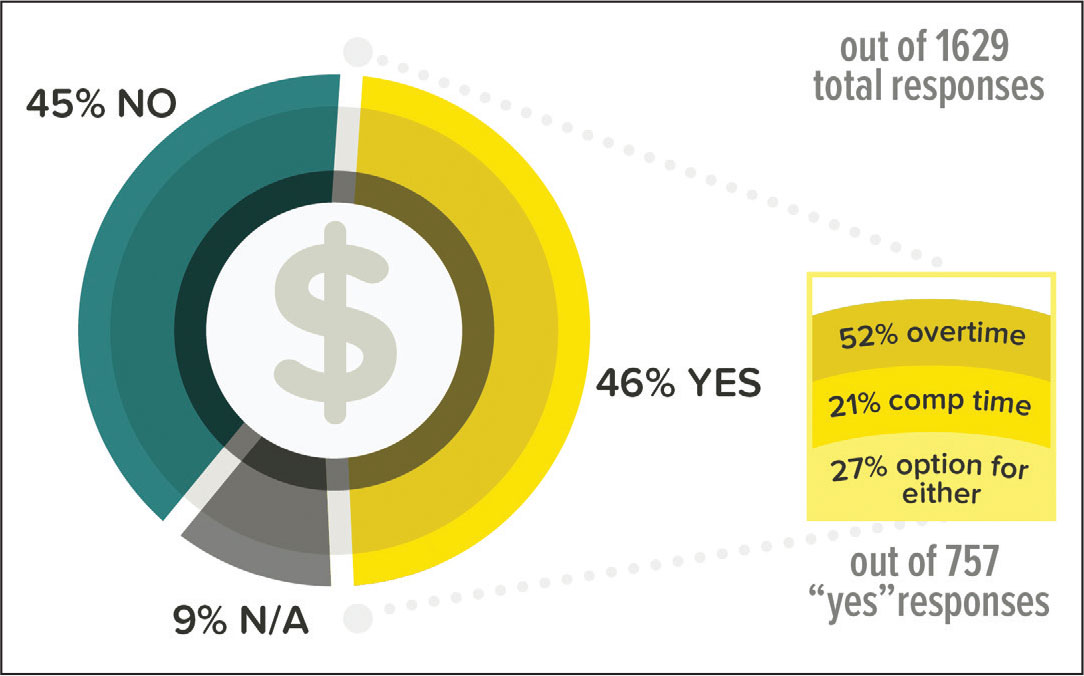
Figure 3. Compensation for overtime.
Conversely, being compensated for overtime is correlated with significantly higher satisfaction with pay/compensation. Of the 1,629 respondents who responded to this question, 46% indicated that they receive pay for overtime and compensatory time for hours worked over 40 in one week, as shown in Figure 3. This group was 20% more likely to report being “satisfied” or “very satisfied” with their pay/compensation than those who are not compensated for overtime.
Interestingly, those who reported being compensated for overtime also reported working an average of two fewer hours per week than those who are not paid for overtime. Reasons for this were beyond the scope of the survey.
Gender Pay Gap
A significant pay gap was reported between genders. Out of 1,401 men and 553 women who provided pay data, women reported making $27,500 per year less than men, on average, which amounts to women making approximately 75% of the salaries of their male colleagues. When controlling for years of experience and full-time employment, men still reported making significantly more money than women.
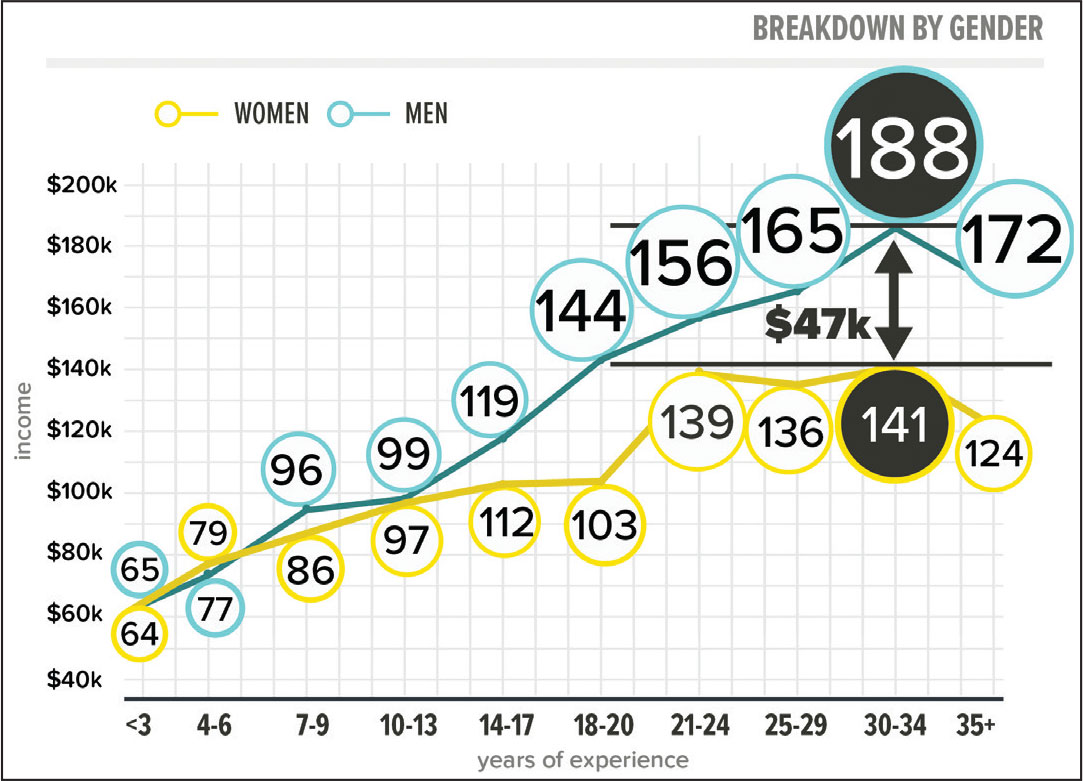
Figure 4. Income vs. years of experience (full-time only).
For example, for full-time employees, men with 14-17 years of experience made $7,900 per year more than women, and men with 18-20 years of experience made $41,200 per year more than women, as shown in Figure 4.
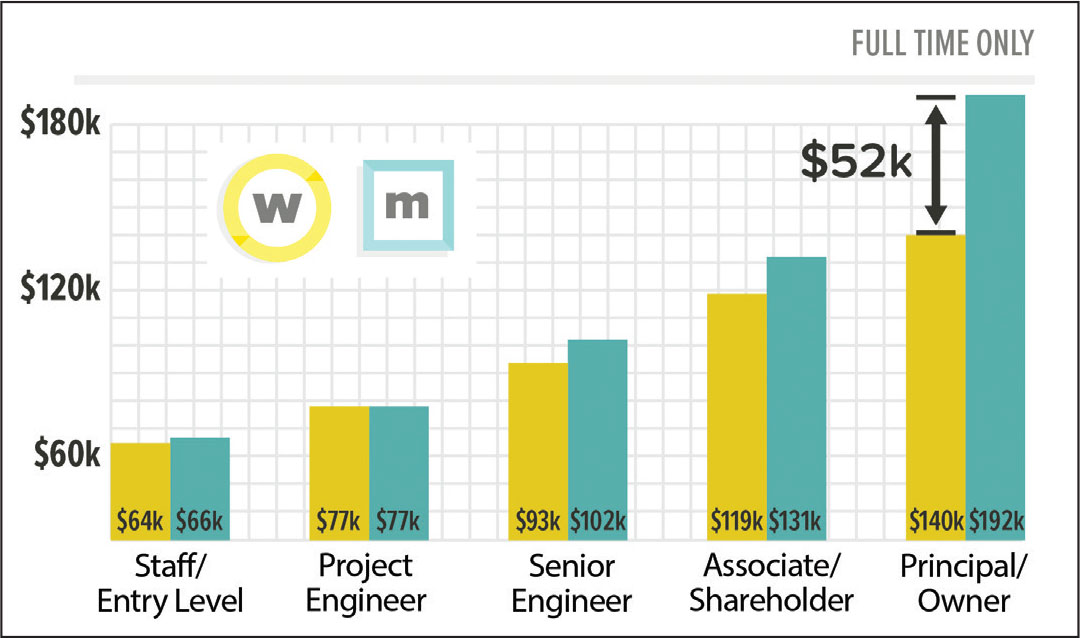
Figure 5. Average income by title and gender.
When broken down by position, a similar trend persisted, though the gender pay gap widened significantly starting at the senior engineer/project manager level. A $9,000 pay gap was present for senior engineers/project managers, a $12,000 pay gap was present for associates/shareholders, and a $52,000 pay gap was present for principals/owners, as shown in Figure 5. Further analyses were performed based on a variety of factors (location, position, full-time employment, firm size, with/without children), and in all cases, the gender pay gap was found to exist.
Additionally, because nearly half of respondents were from California, the gender pay gap within this state was also reviewed. The pay gap was found to be less pronounced in California as compared to the overall data set, but it was still present.
The 2013 SEI survey found that the average annual salary for women was 78% of that reported by men. Similar to the SE3 data, the pay gap widened as the number of years of experience increased.▪