
As the stock of American bridges averages an age of forty three (43) years (Figure 1), it is clearly of great value to understand their remaining service life. When you consider the theoretical design of these bridges was for fifty (50) years, it is inevitable that a high proportion of them will now be deficient. In fact, the number of deficient bridges today is 1 in 9. Within the next ten years this will become 1 in 4.
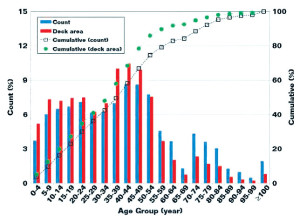
Figure 1. Distribution of American Bridges by Age. Courtesy of Nace International.
It is critical to implement service life prediction (SLP) models so an appropriate rationale is incorporated in the decision making process can be made on which bridges need attention first. With aging infrastructure, it is common practice to deal with the most critical conditions on a structure (typically visual failures) in a reactive manner. This is always more costly and, in extreme cases, tends to be done on an emergency basis due to possible health and safety issues.
SLP models of ageing infrastructure should be implemented to ascertain whether the materials have exceeded or are approaching their minimum acceptable value when routinely maintained. Service life is defined by the following three categories (Sommerfield et al. 1986):
1) Technical Service Life – The time in service until a defined unacceptable state is reached
2) Functional Service Life – The time in service until the structure no longer fulfils the functional requirement
3) Economical Service Life – The time in service until the replacement of the structure (or part of it) is more economical than keeping it
This article willfocus on Item 1 above, the technical service life, and look at how condition states are defined in order to predict a time to an unacceptable condition. There are a number of recognized condition state methods for bridge owners to classify their structures. The National Bridge Inventory (NBI) from 1988 is typically used, as shown in Table 1.
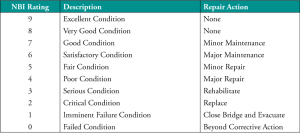
Table 1. National bridge inventory condition rating Federal, Highways Administration (FHWA) 1988.
Some bridge owners adopt their own classification systems, or use other systems as bridge management tools such as AASHTOWare™ Bridge Management software (BrM). These tools allow bridge owners to efficiently monitor costs, schedules, inventories, inspections, performances, displacements, and safety. In addition, AASHTOWare™ helps prioritize where and how funds should be spent, facilitates rapid creation of reports, enables prompt payments to the federal government and contractors, and provides faster receipt of federal funds.
Understanding Corrosion Condition
Corrosion is regarded as the primary cause of deterioration in reinforced concrete structures. Although other damage mechanisms exist, corrosion is the primary mechanism of concrete failure which impacts service life; this, in turn, makes it the number one item to fully understand as it will eventually leave the bridge unsafe.
One method for determining corrosion condition is to use a five state system, defined as shown in Table 2.
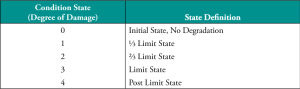
Table 2. Corrosion state interpretation of condition state definition.
This more simple approach facilitates an understanding of the degree of damage of the degradation of reinforcing steel over time, and allows for the classification of condition states.
The procedures typically used to predict the remaining service life can be expressed following the non-destructive evaluation definition (NDE) by Rilem, an international union of laboratories and experts in construction materials, systems and structures, as follows:
1) Identify accurately the root cause of the problem
2) Confirm potential evolution of damage, and if any, at what rate?
3) Determine the severity level of the problem, its location and extent
By following the three main requirements of NDE, sufficient data is collected to portray this information in a more simplistic manner by using statistics. Nearly everyone understands a statement such as “50% of your structure is deficient” whereas very few understand a comment such as “chloride levels are 1000 parts per million (PPM) and corrosion rates are measured in microAmps per square centimeter (100uA/cm2).”
Once the value of the NDE survey is demonstrated, it is essential that a sufficient volume of data is collected for each of the structural components of greatest concern. This data is critical in enabling a more accurate prediction. If only 1% of the structure is assessed, accuracy will not be as good as if 10% has been surveyed. An appropriate, representative sample of testing must be conducted in order to achieve satisfactory confidence levels regarding the bridge’s condition; this needs to balance information required to compile the most accurate and appropriate service life predictions, while working within the confines of the budgets available at the investigation phase of a project.
NDE is the key to understanding remaining service life; it forms the foundation of knowledge integral to assessment techniques. As indicated above, the first requirement is to understand the root cause of the problem and not necessarily the problem itself. All too often, a failed drainage system is left unrepaired when ultimately the resulting water infiltration is the root cause of the corrosion problem.
The second requirement of NDE is to understand the elements of the structure which are unknown. Often, known conditions are easily ascertained visually. As shown in Figure 2, as the structure deteriorates, the known (typically visible) conditions increase while the unknown conditions decrease. The key is to identify the time it takes for the condition state to change from one state to the next. When assessing limit states, as the structure encroaches the end of limit state three (3), those components that are at or beyond limit state 3 have become obsolete.
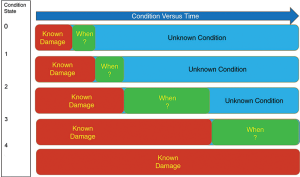
Figure 2. Condition versus Time Relationship.
This is the basis of service life prediction and, as with nearly all structures, these conditions vary considerably around different components, sometimes even within the same component. An example of this would be a reinforced column positioned in water where conditions vary significantly. This is the key principle in the third requirement of NDE, determine severity, extent and location.
Without gathering information using NDE surveys, it becomes difficult to predict service life with an acceptable level of accuracy. Gathering as much field data as possible to ultimately allow for a more accurate repair design approach is highly recommended.
As stated earlier, the primary cause of distress to the structure is reinforcement corrosion; an understanding of how this phenomenon will affect service life is critical. This can be achieved in two ways, one by conducting corrosion measurements in the field and secondly by modelling. For corrosion measurements in the field, there are numerous claims about predicting corrosion condition and risk which do not necessarily warrant a corrosion rate measurement. These techniques may provide a guide to understanding where corrosion may be occurring, but they do not quantify the amount of corrosion which is occurring at the present time. Two such examples are Half-Cell Potential and Surface Resistivity measurements. On the contrary, Corrosion Rate measurements measure corrosion current.
Half-Cell Potential measurements, performed in accordance with ASTM C876, provide the risk associated with corrosion and the characteristics indicated in Table 3. In some circumstances, these results can be misleading. Because this testing procedure was developed for reinforced concrete structures impacted by chlorides or deicing salts, the results of a survey on a bridge suffering from carbonated induced corrosion would yield very different values.
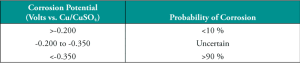
Table 3. Likelihood of corrosion damage as a function of the corrosion potential.
Surface Resistivity is a measurement of the resistance of the concrete and not corrosion of the actual steel. Resistivity measurements provide a mapping of lower resistance areas, which may be associated with moisture and thus potentially high chloride ion levels.
Both Half-Cell Potential and Corrosion Rate assessments are typically restricted to smaller, localized test zones, due frequently to the nature of the data. The tests also require a connection directly to the embedded reinforcement and require the steel under assessment be continuous. Both test methods require targeted exposures to be made at the surface, which often limits the test zone sizes due to the logistical challenges involved in coring or probing a bridge that is in service.
A number of additional NDE techniques, such as Surface Penetrating Radar (SPR), magnetics, acoustics and infrared thermal imaging are also available. In most cases, data can be collected more rapidly and can cover larger areas with these techniques, providing the inspection team and the bridge owner with a more comprehensive data set across the structure.
(Note: As technology improves, a new method called a backscatter X-ray is also gathering momentum in the inspection industry, making X-ray images clearer and the equipment more portable for site deployment.)
Combining data sets from the various techniques discussed above and cross correlating the information is very important. Reliance on data collected using just one or two techniques can lead to inaccurate data, leaving the assessment open to misinterpretation and ultimately the development of poor repair designs. The best possible testing scenario is to use techniques such as Half-Cell Potential and Corrosion Rate, which do provide focused information regarding the condition of embedded reinforcement, in concert with some or all of the other more rapid NDE techniques.
It is also important to consider the bridge’s construction, in addition to its condition. When reinforced concrete (RC) bridges are constructed, they rarely conform perfectly to their original design intent. This leaves the condition testing results and any subsequent repair designs open to failure where assumptions are made regarding the placement of the embedded reinforcement. Techniques such as SPR, when combined with metal detection and sometimes X-rays, not only provide vital condition related information, but also, critically, information regarding the as-built arrangement of the bridge.
Service Life Modelling
The Corrosion Rate measurements technique is fundamental when using models to predict service life. Different techniques of corrosion rate testing exist and there are a number of commercially available pieces of equipment. Corrosion rate measurements provide a corrosion current relative to a surface area being tested.
The most common technique in measuring the corrosion current is the linear polarization resistance (LPR) measurement. This measurement relies on the slope of the current versus voltage (ΔI applied/ΔE) response of the corroding interface at or near its natural free corroding potential. This slope is related to the corrosion current by the Stern-Geary equation.
In order to calculate the actual weight loss, corrosion current (Icorr) is substituted into Faraday’s equation. Faraday’s equation for steel loss equates to 1uA/cm2 = 11.6 microns per year (um/yr-1) or 0.457 mils per year (mpy). It should be noted that rust growth can average up to three times the volume of the section loss, which means for the example above, 34.8 um/yr-1 or 8.226 mpy would be the actual volume of corrosion product. Laboratory tests (Rodriguez, 1994) found that 15-40 um gave rise to cracking on bars with a cover/diameter ratio between 2 and 4.
After all of the data is gathered via NDE (and targeted probing/coring for verification), the information is collated and is used to help create the service life models. Multiple corrosion service life models are available for existing structures: These models provide an understanding of when corrosion will initiate and, once initiated, when propagation will impact performance leading to various levels of degradation. One of these methods is to look at the reduction in steel cross section where the corrosion current (Icorr) is converted into the reduction in the diameter of the reinforcing steel. The results are then converted into a service life prediction by modelling the effects of reducing the cross section of the reinforcement on the load capacity of the reinforced concrete structure. Models can also address the ingress of contaminants, such as chlorides and sulfates, and chemical reactions, such as carbonation, and when thresholds at the steel will be reached.
For new structures, numerous models are available. One model for corrosion initiation commonly used is a simulation of Fick’s Second Law of Diffusion. This calculates the chloride penetration until the time of depassivation, adjusted to allow for the time dependency of the chloride diffusivity as seen in Figure 3.
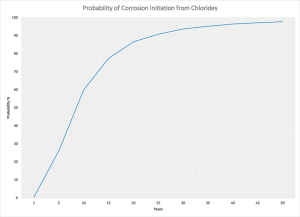
Figure 3. Corrosion initiation probability model.
Conclusions
Predicting the service life of reinforced concrete bridges is a complex subject and requires a very careful balance of NDE, physical probing, coring and lab testing. Most importantly, accurate predictions require experienced corrosion experts who can collate this information and determine the following as accurately as possible:
- The As-Built Arrangement (does the bridge conform to the original design intent)
- The Existing Condition (mainly, what is the condition/corrosion level of embedded steel reinforcement)
With this information, accurate service life predictions can be made that will target not only the visible deterioration on a bridge, but also the unknown chemical conditions occurring which impact corrosion and subsequent performance. Corrosion is often slow to initiate, and hidden conditions can be occurring which are not yet significant enough to result in cracking and spalling. These unseen conditions are ultimately the most important area of the bridge to understand in order to achieve the best possible service life of the structure. By being predictive in service life models and understanding corrosion degradation, one can be proactive in the repair approach.▪