
Vertical Lift Highway Bridge in Canada
In this article, detailed description of the modeling and evaluation of a steel vertical lift highway bridge located in Ontario, Canada is presented. The bridge spans a major transportation waterway for ships and barges carrying 40 million tons of valuable cargo annually, and continues to be a major factor in the growth of cities like Toronto, Cleveland, Detroit, and Chicago. Hence, it is considered a Lifeline Bridge for all evaluation purposes.
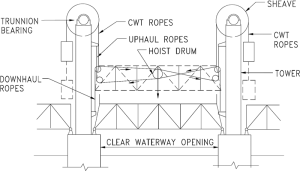
Figure 1. Configuration of a vertical lift bridge.
A typical configuration of a vertical lift bridge is shown in Figure 1. The towers at each end of the lift span contain sheaves over which wire ropes pass. These ropes connect to the corners of the lift span and to the concrete counterweights. The lift span accommodates the motors that drive the operating drums (all housed within an operator house and machinery room), and set a series of uphaul and downhaul ropes into motion. The ropes, sheaves, and counterweights work similar to an elevator. The counterweights balance the lift span and minimize the power needed to operate the bridge. Hence, the dead load is nearly balanced in the seated condition, and only live load is resisted by the lift span bearings. During the lift operation, the lift span and counterweights move along guides attached to the front column of the tower. The guides restrain global movements during operation but permit thermal movements.
The two-lane, two-way bridge under consideration was constructed in 1930 and is composed of two 70-foot tower spans and a 208-foot lift span. The floor system consists of a concrete deck on crossbeams, supported by stringers and floorbeams. The deck is composite with the crossbeams and floorbeams.
The intent of the owner was to conduct a bridge evaluation for dead, live, wind, and seismic loads as per Canadian Bridge Code CSA S6-14 (henceforth called “the Code”). CSiBridge software was used to develop two models, namely a three-dimensional Wind and Seismic Model (M1) and a simplified Live Load Model (M2), to accurately capture the inherent difference in response of a bridge under lateral and vertical loads. Section properties and member capacities for all members were computed based on as-built drawings and the code.
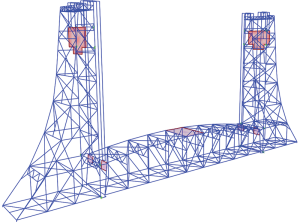
Figure 2. Three-dimensional M1 model of the bridge.
Wind and Seismic Model (M1)
The M1 model evaluates the bridge structure under wind and seismic forces, and provides demand-to-capacity ratios for two operating conditions: lift span-seated and lift span-raised. The structure was evaluated under ultimate limit states in accordance with several lateral load combinations derived from the Code. The model consists of main truss and tower members, laterals and braces, ropes, sheaves, counterweights, guides, and bearings as shown in Figure 2. These elements were modeled by utilizing a series of frame elements, links, and shells. The model treats the structure as linear and elastic due to the adopted wind and seismic analyses.
Guides of Lift Span and Counterweights
Guides provide a load path for wind and seismic loads, from the lift span and counterweights to the front tower columns. That load path is dependent on the directionality of the applied load and the restraint provided by the guide. The guide is only effective at transferring forces when the lateral load causes the lift span and/or the counterweights to displace and the guide(s) to contact the front column. The displacements allowed by these guides are in the range of ½-inch to 1 inch. Additionally, some guides are able to restrain movement in the longitudinal and transverse directions, whereas others only restrain transverse movement. Accurately modeling these effects is vital to representing the response of the structure to wind and seismic loads from all directions.
The guides were modeled as linear spring elements. A distinction was made between guides in contact with the front column and guides not in contact by adjusting the stiffness parameters of the springs. The stiffness of the spring elements was iterated in order to reasonably match the expected movement at these locations to simulate its expected nonlinear behavior.
Wind Analysis
The wind loads were developed based on a return period of 50 years and the applicable coefficients prescribed in the Code. The loads were applied as equivalent horizontal and vertical static loads, uniformly distributed across the lift span truss, tower members, counterweights, sheaves, and operator house.
For regular bridge structures with a short vertical profile, the applied wind pressure is assumed constant and a uniform exposure coefficient is assigned. Because the lift bridge under evaluation is tall, the structure was divided into three different wind exposure zones.
Although the bridge was originally designed for 30 pounds-per-square-foot wind load, current Code requirements result in a higher wind load. Hence, after evaluation, it was found that several of the tower members and portal frames were inadequate in combined axial and flexure. It was recommended that these members be strengthened or replaced during the next major rehabilitation.
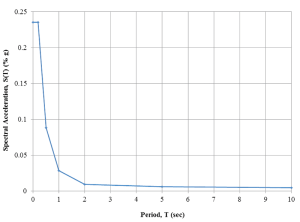
Figure 3. 5% damped response spectrum used for seismic evaluation.
Seismic Analysis
An Elastic Dynamic Analysis (EDA), and more specifically a multi-mode elastic response spectrum analysis, was selected as the appropriate means for evaluation. This is a force-based approach, wherein the forces derived from the elastic response spectrum corresponding to a 2475-year return period were compared directly to the elastic capacities of the truss members. Location-specific, 5%-damped spectral acceleration values were adopted from the Canadian Building Code and Site Class A (Hard rock) parameters were used to develop the response spectrum (as shown in Figure 3) for this lifeline bridge. Primary bridge modes were computed using Eigenvector analysis assuming 5% damping, and combined using the CQC method to determine response forces.
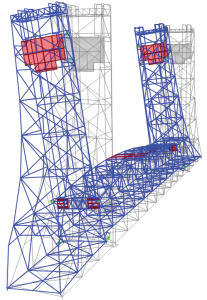
Figure 4. Dominant transverse vibration mode for the span-seated condition (T = 3.80 seconds).
The structure is relatively flexible, as a significant portion of the seismic mass is suspended from the tower by ropes; the dominant vibration periods range from 1 second to 5 seconds (as shown in Figures 4 and 5). The suspended masses also tend to dampen the seismic response of the tower, and the bridge is located in a generally low seismic region. Consequently, the structure was found to have no deficiencies for seismic loading.
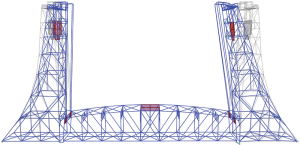
Figure 5. Dominant longitudinal vibration mode for the span-seated condition (T = 1.62 seconds).
Live Load Model (M2)
The M1 model was simplified by deleting sway frames, laterals, and tower frame members above the first level of the top chord, since initial runs of the live load on the M1 model showed negligible forces in these members. The resulting M2 model is used for live load rating of the truss members and floor system.
Stringers were added as simply-supported members between the floorbeams. The axial constraint was released so that no axial forces were induced in the stringers as a by-product of analysis. Since the shear connection of the floorbeam to the truss bottom chord results in significant fixity, no end releases were applied to the floorbeams in the model. The span supports were modeled as hinged at one end and rollers on the other end. The final live load model framing is shown in Figure 6.
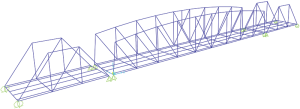
Figure 6. Three-dimensional M2 model showing trusses, stringers and floorbeams.
Modeling the Dead Loads
The dead loads from the asphalt wearing surface, deck, crossbeams, and stringers were applied as individual line load cases on the stringers, since the Code applies separate load factors to these dead load components. The self-weight of the floorbeam was modeled, and forces in the floorbeam due to the above cases were derived from the stringer.
The original as-built plans provided dead load concentrations on the panel points of the lift span and the towers. These were input as point loads after adjusting for the already applied floor system loads. The dead load forces in the truss members were then determined for two cases.
a) Counterweight active: To simulate this case, an upward force equal to one-quarter of the span weight (minus 1 kip) is applied to the top chord corners of the lift span, to represent the upward pull on the span transferred from the counterweight by the ropes.
b) Counterweight under repair: This is a special service condition of the vertical lift bridge, where the counterweights/ropes are under repair and are removed or independently supported. Hence, the rope is inactive and the bridge essentially behaves like a fixed bridge spanning between the supports. Maximum dead load reactions are experienced at the lift span supports.
An envelope of these two cases was taken as the dead load force in the lift span truss members. This methodology of finding critical dead load forces is unique to vertical lift bridges.
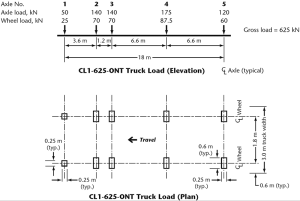
Figure 7. Canadian Bridge Code truck load model.
Modeling the Live Loads
The aspects of live loads and evaluation levels described below are unique to the Code. The Code presents the Ontario-specific truck load of 625 kilonewtons (140.5 kips) and the Ontario-specific lane load as shown in Figures 7 and 8. The uniformly distributed load of 9 kilonewton per meter (0.62 kips per foot) corresponding to a Class A highway was determined based on the average daily traffic and average daily truck traffic data provided by the owner. Evaluation Level 1 was chosen for the first run, which represents vehicle trains in normal traffic. If the bridge members did not rate for Level 1, then Level 2 or Level 3 live loads were applied, which represent 4 axles and 3 axles of the truck, respectively.
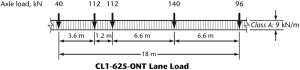
Figure 8. Canadian Bridge Code lane load model.
Load Factors for Dead and Live Loads
Another unique aspect of the Canadian Code is the selection of load factors based on target reliability indices. The target reliability index in turn is based on three factors.
a) System behavior categories S1, S2, and S3: Correlates the member failure to total collapse, partial failure, and local failure of the bridge, respectively. S1 for the truss members and S3 for the floor system were chosen.
b) Element behavior categories E1, E2, and E3: Correlates the loss of capacity of a member to sudden failure, sudden failure with post-failure capacity, and gradual failure of the member, respectively. E3 was chosen for the truss members and the floor system.
c) Inspection level categories I1, I2, and I3: Correlates the inspection effort for a member to the involvement of the evaluator during the inspection. I2 was chosen since all members were inspected to the satisfaction of the evaluator.
As per the Code tables, the above three factors resulted in a reliability index of 3.25 for the truss members and 2.75 for the floor system members, and were then used to find the load factors for input into the rating equation.
Live Load Rating
The Live Load Rating factor for a member, F, is given by the equation:
F = Resistance – Effect due to ∑(Dead loads × Dead load factors)/Effect due to governing (Live Load × Live Load factor)
The effect of dead loads and live loads were obtained from the bridge model output. Rating factor F was then calculated. All members of the trusses and the floor system were found to be adequate under live loads.
Conclusion
This article provides some of the unique aspects of modeling and analyzing vertical lift bridges, and briefly highlights the specific aspects of the Canadian Bridge Code. Any structural engineer tasked with modeling lift bridges should pay special attention to dead loads on the lift span; these loads play a critical role in the balance of the bridge, live load ratings, and seismic analyses. The operating conditions of the lift span affect the dead load forces and behavior under lateral loads. Lastly, the inherent flexibility of the towers and the directional-dependent load path through the front column guides also influence the behavior under lateral loads.▪