
For Structural and Bridge Engineers
A new method has been developed for measuring the force of ground shaking during earthquakes at particular locations. The proposed Earthquake Shaking Force (EqSF) rating is based on the maximum vector sum of the recorded ground accelerations in the three main directions scaled with the strong ground motion duration. An equation for calculating the Earthquake Force values is proposed. This new method has been used to analyze and compare more than 220 ground station recordings from 48 earthquakes in the United States and around the world. The results show that the new method can provide objective ranking of the ground shaking forces, and can help engineers in designing seismically-resistant structures.
Today geologists and engineers use Magnitude scales and the Modified Mercalli Intensity scale to measure and rank earthquakes. For a century the Modified Mercalli Scale has been used for evaluating the intensity of local ground shaking. Different versions of this scale are still used, with its twelve-point range from I to XII, around the world. The Modified Mercalli Scale is based on the feelings and reactions of individuals and on observed damage to structures and underground facilities. This makes the scale subjective and inaccurate, because of the different individual interpretations (due to different sensitivity and reactions), the specific construction conditions of the country, the year of construction, or the level of building development.
Some improvement was achieved in California by modifying the Mercalli Intensity scale again, using Instrumental Intensity, in an attempt to correlate the intensity scale values with the peak ground accelerations and velocities. Instrumental Intensity is used by the TriNet system to produce ground shaking maps showing the peak ground accelerations and velocities by ground stations for a specific earthquake.
Today, California and many other states and countries have developed large nets of ground motion recording stations. During an earthquake, all necessary ground motion data are recorded and the Mercalli Intensity Scale is no longer providing reliable information. The new Earthquake Shaking Force method is a step forward in providing objective measurement of the ground shaking based on recorded ground motions during an earthquake.
Measuring the Force of Ground Shaking
This new EqSF approach is created for measuring and comparing the force of ground motions at local sites at a particular distance from an earthquake epicenter.
The Earthquake Shaking Force is based on the well known Newton’s Second Law of Motion F = m * a, where the inertial force F, equals the mass m, multiplied by the acceleration a. Engineers are using the same basic principle to determine the lateral seismic forces for designing buildings and structures. The shaking force values are calculated using the instrumental readings for ground accelerations and the duration of strong ground motions. Similar to the Richter Scale, the proposed method does not have a fixed top limit and the calculated values are rounded to the first decimal digit. Based on the highest recorded peak accelerations, we should expect a ground motion rarely to exceed EqSF level 13–16. As a reference for a recorded ground shaking with total acceleration (the space vector sum) equal to 1.0g and strong motion duration of 20 seconds the calculated EqSF value is 9.8.
The physical meaning of the proposed scale value is a force equal to the maximum vector sum of the ground accelerations in x, y and z directions (within an interval equal or less than 1.5 sec) in m/sec/sec multiplied by one unit mass (m=1) (Figure 1). This theoretic value is corrected for vertical acceleration and duration. The whole calculated value is scaled in order to receive a range closer to the values used in different intensity scales.
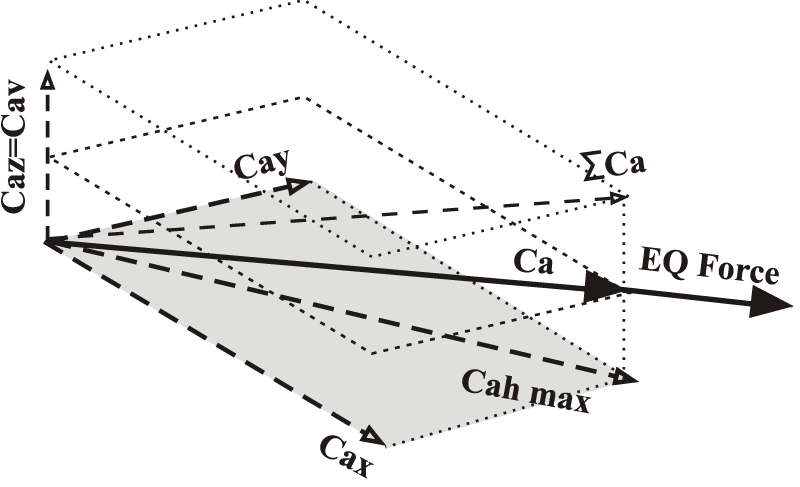
Figure 1. Earthquake Shaking Force, 3D vector sum of ground accelerations.
The formula for calculating the Earthquake force of the local ground motion is:
EqSF = 9.81{[Cahx^2+ Cahy^2 + (Cav/2)^2](t/20)^2}^0.2 Equation 1
where,
Cahx, Cahy and Cav are the corresponding horizontal and vertical accelerations (g) in x, y and z directions that provide the maximum vector sum,
Cav/2 is the correction accounting for a relatively reduced impact of the vertical acceleration,
t is the duration of strong ground motions in seconds,
t/20 is a correction for the strong motion duration,
^0.2 is the scaling correction for the 3D vector value (in lieu of ^0.5),
9.81 is the acceleration of gravity in m/sec/sec
m is the mass, taken as 1, which therefore does not appear in the equation.
All accelerations are taken from the three seismograms (two horizontals and one vertical) recorded at a ground station for a particular event. The time interval considering simultaneous action of the corresponding accelerations in three perpendicular directions is taken as 1.5 seconds. The duration of strong motion is the modified “bracketed duration” for the time interval between the first and last acceleration peaks greater than 0.1g. For the strong motion duration an upper limit of 75 seconds is used. An exception is made for seismograms with acceleration peaks smaller than 0.1 g that should result in t = 0 and EqSF = 0. The EqSF value for such earthquake readings is calculated with duration (t) equal to 0.5 seconds in order to allow comparing their ground shaking force with the forces at other locations. The original “bracketed duration”, proposed by Page et al. and Bolt accounts for the intervals between 0.05 g peaks.
When accelerations are given in cm/sec/sec, the EqSF values may be calculated directly from:
EqSF = 0.6237{[Cahx^2+ Cahy^2 + (Cav/2)^2](t/20)^2}^0.2 Equation 2
The correction for vertical acceleration is introduced to account for its relatively smaller influence on structural damage. Reduction factors from 1 to 3 produce small differential results less than 7 percent; therefore the final selected reduction factor is 2.
The t/20 is introduced to account for the influence of ground motion duration on structural damage. Twenty (20) seconds were selected as basic duration based on the analysis of more than 100 earthquake records. The scaling correction (^0.2 in lieu of ^0.5) is to reduce the sharp increase in calculated degrees between smaller and greater acceleration values, and to scale the values closer to the traditionally used values in earthquake scales.
The above modifications were selected based on calculated EqSF values for some sites with available ground motion data from the Northridge, Loma Prieta, San Fernando, and Kobe earthquakes. The data used are from the Strong Motion Data Center on the Internet – homepage of the Department of Conservation, Division of Mines & Geology. Some data for the sites not listed on the web are based on presentations and publications following the Northridge Earthquake by Kircher (1994) and Somerville (1997). The data used was updated later based on the registered seismograms made available on the COSMOS website.
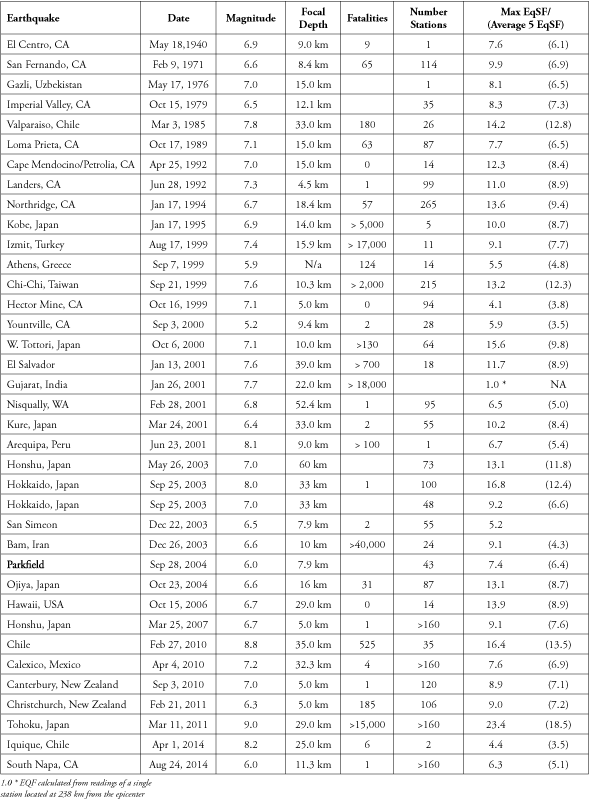
Table 1. Earthquake Information for Selected Major Earthquakes.
Study on Available Data from Earthquakes Recordings
More than 40 earthquakes have been included in this study. The criterion for selecting these earthquakes was based on available information (seismograms), and on magnitudes near or more than 6.0. The main source of information was the website of the Consortium of Organizations for Strong-Motion Observation Systems (COSMOS), listing recorded earthquake data from more than 500 earthquakes and 6,600 stations (by January 2015). From the selected strongest events, more than 150 recorded seismograms were analyzed. The summary of this analysis is presented in Table 1 online including data from El Centro, California in 1940 to South Napa, California in 2014. This table lists the magnitude, the focal depth, number of fatalities, number of stations with recorded data and the maximum calculated EqSF scale at a ground station for the event. One more piece of data is included – the average from the top five calculated EqSF (Average 5 EqSF). When only one station recording is available, the Average 5 EqSF is calculated as 80% of the single station result. The combination of Max EqSF and the Average 5 EqSF provides valuable comparative information for the shaking force of earthquakes. The use of Average 5 EqSF should be combined with engineering judgment. This information is more credible for earthquakes in California, Japan, or Taiwan, where the instrumentation net is well developed and recordings from multiple stations are usually available.
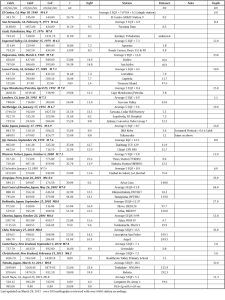
Table 2. Earthquake Shaking Force.
In Table 2 are listed the recorded accelerations, strong motion durations and calculated EqSF values for representative stations for the earthquakes included in this study. These data are structured additionally in a summary Table 3 listing the stations by the calculated EqSF values and provided maximum horizontal, vertical and vector accelerations.
The maximum registered acceleration in one direction is at Tsukidate Station, Japan, on March 2011 – 2,700 cm/sec/sec (2.75g); during the same earthquake at this station are calculated also the maximum horizontal (vector sum) acceleration – 2,983 cm/sec/sec (3.04g), and the maximum total (3-D) acceleration – 3,526 cm/sec/sec (3.59g).
The maximum vertical registered acceleration is at Tsukidate Station, Japan, on March 2011 – 1,880 cm/sec/sec (1.92g).
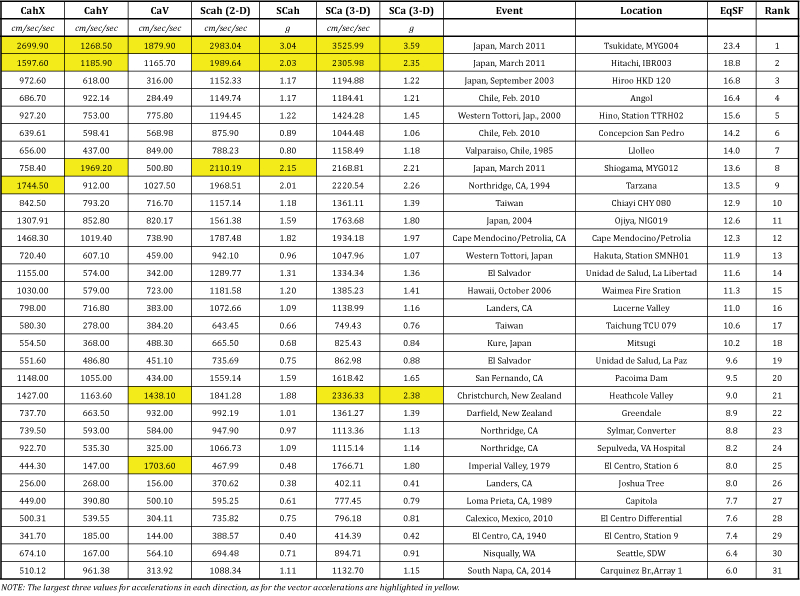
Table 3. Ground accelerations for earthquakes listed per EqSF values.
In Table 3 there are 21 stations listed with horizontal accelerations exceeding 1.0g, and 27 stations with total (3D) acceleration exceeding 1.0g.
The longest strong ground motion duration, 68 sec., is recorded at Talca Station, Chile, in 2010, whereas the duration recorded at Hiroo Station, Japan, in 2003 is 65 sec., and the duration at Hokoto Station, Japan, in 2011, is 58 sec. The longest duration in California is at Maricopa Station, during the San Fernando earthquake in 1971 (31.5 sec.).
The highest EqSF value is calculated for the Tsukidate Station, Japan, in 2011 (23.4). The Tarzana Station has the highest EqSF value calculated in the US (13.5).
The first three places for the Average 5 EqSF are for Valparaiso, Chile (12.8), Chi-Chi, Taiwan (12.3), and Western Tottori, Japan (9.8). The highest Average 5 EqSF in California is for Northridge (9.4).
Frequency Influence on EqSF Determination
Part of this study was an attempt to include in the EqSF scale the influence of the earthquake frequency (Hz or cycles in seconds) in addition to the acceleration and strong motion duration. Two optional criteria were studied – average frequency measured for “10-second bracket” and measured for the entire “strong motion duration”.
It was concluded that it is difficult to avoid some subjectivity in measuring the frequency. The criteria were based on full cycles (cycles with vibrations registered on both sides of the neutral axis), but objective criteria could not be established. The studied two bracket durations give different results: the variation increases with the strong motion duration. The tolerance in reliability of measurement of the frequency is estimated as 15 to 20%. There is almost no difference in frequency between recorded seismograms in two perpendicular directions. For several records (with peak ground acceleration varying between 226 and 1,019 cm/sec/sec or 450%), the impact on EqSF values was found to be less than [(2.3/1.7)^2]^0.2 = 1.12 (or less than 12%).
Considering the element of subjectivity and the small influence of the frequency variation on EqSF, determination (less than 12% compared to a larger percentage of non-accuracy from 15% to 20%), the frequency was abandoned as having a minimal effect on the calculated EqSF values.
Conclusions
The EqSF approach is based on objective measurements and provides useful data for professional engineers. This method provides reliable comparable data for the forces of local ground shaking that will complement the current information available after an earthquake. The EqSF takes into account all three components of the ground accelerations plus the strong motion duration. The EqSF values can be calculated for all local ground stations with recorded seismograms. The force at a particular location can be compared with the force at any other locations during the same seismic event or previous events. The EqSF values could be provided for different locations after an earthquake, much like temperatures and rainfall recordings. Depending on the relative locations and specific soil characteristics, EqSF values will differ even between parts of a large city. These results will reflect the different levels of ground shaking and therefore will provide a more realistic representation of the event.
The EqSF method is devised to measure and compare the force of ground motion but is not intended to measure earthquake damage.
However, the EqSF method could be used to calculate and rank all ground motions recorded at particular locations from previous earthquakes, and used to create maps as visual logs of EqSF values based on previously recorded seismograms. The accumulated data may be used in the future by local building departments, insurance and real estate companies for better assessing the potential seismic danger and may help creating micro-seismic zones. Comparing the performance of different structural lateral resisting systems during earthquakes resulting in identical or similar EqSF values may help adjust the response modification factors (R) used in the seismic design for buildings and structures. Further analysis and research using the EqSF scale may provide improved understanding of earthquakes and the resulting propagation of ground motion and damaging forces.▪
References
Kircher, C. A., 1994, “Northridge Earthquake: Lessons Learned, Ground Motion,” 1994 SEAONC Spring Seminar, San Francisco, CA.
Lee, W. H. K. and Shin, T. C., 2001, Chi-Chi, Taiwan, “Earthquake of September 21, 1999 Reconnaissance Report, Strong Motion Instrumentation and Data,” Earthquake Spectra 17 (Supplement A), 1-16.
“Northridge Earthquake January 17, 1994, Preliminary Reconnaissance Report,” Earth Science 1994 (Earthquake Engineering Research Institute,) 9-15.
Somerville, P., 1997, Engineering Characteristics of Near Fault Ground Motion, Proceedings, SMIP97 Seminar on Utilization of Strong-Motion Data, Los Angeles, CA.
COSMOS Virtual Data Center, www.strongmotioncenter.org/vdc.
NEIC (National Earthquake Information Center), www.earthquake.usgu.gov.
Strong Motion Data Center, www.strongmotioncenter.org.