
Two major earthquakes hit the Cephalonia Island of Greece on January 26th and February 3rd of 2014, with magnitudes of M = 6.0 and 6.1. For comparison, the recent South Napa earthquake of August 24, 2014 had M = 6.0 (EERI, 2014) and the Northridge earthquake of 1994, which has been used in development of seismic codes, had M = 6.7 (NCEER, 1994). An extensive United States (U.S.) reconnaissance mission was mobilized as a collaborative effort of the Geotechnical Extreme Events Reconnaissance (GEER) Association (supported by the National Science Foundation), the Earthquake Engineering Research Institute (EERI) and the Applied Technology Council (ATC). The U.S. reconnaissance team worked together with the Greek earthquake engineering community in a multidisciplinary international team. The GEER/EERI/ATC issued a report of their findings in 2014 and their authors’ input to this article is gratefully recognized.
The reconnaissance team documented the post-earthquake condition of several two and three story reinforced concrete (RC) structures that were designed according to the local seismic code. These structures are located in close proximity, some as close as 150 feet (50 m), to strong motion accelerometer stations that recorded some of the strongest sequences of ground motions known in Europe. The documentation includes photographs, observations, and as-built drawings with design calculations. These structures exhibited surprisingly good structural behavior for the level of shaking they experienced, which changed the focus to observations of resilient structural performance instead of failures, as is usually done in other earthquake studies. This paved the way to a new generation of reconnaissance.
This article attempts to explain the resilient behavior of the local type of construction that sustained significantly higher accelerations than their design accelerations with minimal structural damage, some non-structural effects, and no loss of life or significant injuries. One of the documented RC structures was modeled and analyzed using actual recorded ground motions. The results provide some hypotheses of the factors that may have contributed to the observed behavior, which will hopefully enhance our understanding of seismic resiliency of short RC buildings.
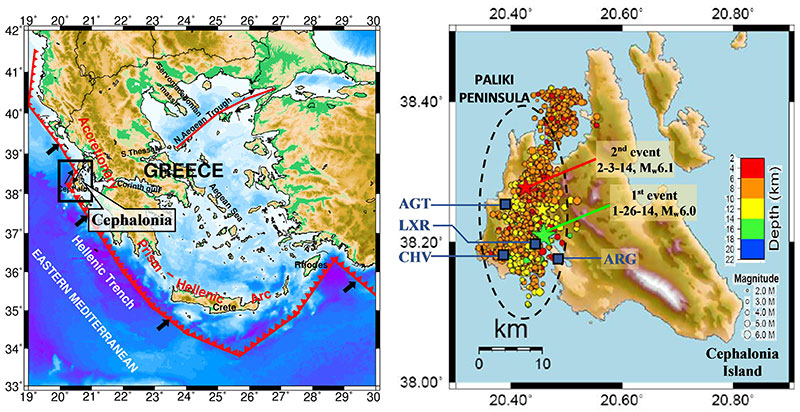
Figure 1. (left) Location of Cephalonia Island of Greece. Hellenic Trench tectonic feature of the Mediterranean Sea (Papaoioannou et al., 2006); (right) Epicenters of 1st M6.0, 1/26/14 event (green star) and 2nd M6.1, 2/3/14 event (red star). Squares show selected EPPO-ITSAK strong motion stations.
Seismic Background and 2014 Events
Cephalonia is located in the Ionian Sea at western Greece, on one of the most tectonically active features of Europe: the Hellenic Trench, with ongoing subduction of the African Plate beneath the Aegean Sea and Eurasian Plates (Figure 1). In addition, the island is crisscrossed in different directions by various types of faults (normal, reverse and strike-slip). Due to its tectonic environment, Cephalonia has a remarkable seismic history which can be traced back to antiquity, with documentation of the strongest historical events since the 15th century AD available in a book by Papazachos & Papazachou (2003).
In recent history, the sequence of destructive shocks of 1953 is of significant importance, as it led to the development of the first Greek Seismic Code in 1959. The largest event had a magnitude M = 7.2 and caused serious damage in all of the Ionian islands with complete destruction of Cephalonia, Zante and Ithaca, including collapse of 27,659 out of 33,300 houses and 455 fatalities.
A similar sequential pattern was repeated in 2014 with two main events on January 26
(M = 6.0) and February 3 (M = 6.1). Buildings in the epicentral region experienced Peak Ground Accelerations (PGA) up to 0.75g and Spectral Accelerations (SA) around 2.5g short structural periods (T) between 0.2 and 0.3 seconds. Most of the structural damage occurred during the second event in the Paliki peninsula, Figure 1b (page 25), since many structures had already suffered damage during the first event. Strong motion station locations and their recordings were available by the Institute of Engineering Seismology & Earthquake Engineering (EPPO-ITSAK, 2014) and the National Observatory of Athens, Institute of Geodynamics (NOA-IG, 2014). Stations at the capital, Argostoli (ARG2), and towns of Lixouri (LXR1), Chavriata (CHV1), and Aghia Thekli (AGT1) by EPPO-ITSAK are shown in Figure 1b.
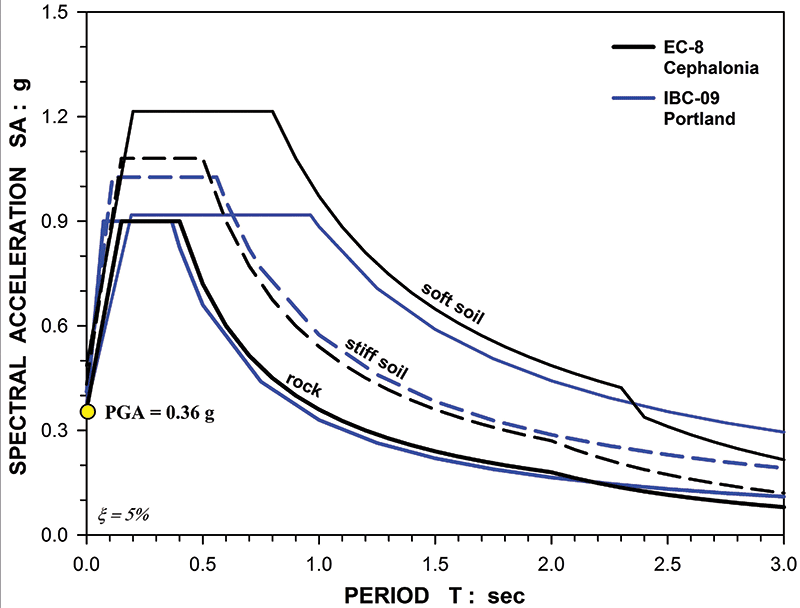
Figure 2. Comparison of response spectra for rock, stiff, and soft soil conditions for: Cephalonia Island, Greece based on EC-8 (black lines) and Portland, Oregon based on MCE of IBC-2009 (blue lines). Both cities have equivalent rock short period acceleration Ss = 0.9 g (or PGA = 0.36 g).
Design Codes and Recorded Motions
The first Greek seismic code of 1959 was supplemented in 1985, and a next generation of seismic codes took effect in 1995. This code was modified in 2000 to include the European pre-Standard – ENV provisions (predecessor of Eurocode), and was finalized with the name EAK (Greek Seismic Code). In 2012, the provisions of Eurocode (EC-8) were enforced in conjunction with the occasionally more stringent EAK. Based on the EC-8 code, Cephalonia falls on the highest seismic zone of Europe, with a PGA of 0.36 g on rock. Figure 2 presents EC-8 code spectra for different site conditions, generally constructed in a similar manner to the International Building Code (IBC).
A U.S. city with an equivalent seismicity to Cephalonia is Portland, Oregon with a Maximum Considered Earthquake (MCE) PGA = 0.36 g or a short-period Spectral Acceleration of Ss = 0.9 g in rock class B (IBC-2009, based on the American Society of Civil Engineers’ ASCE 7-05). For comparison of EC-8 and IBC-2009 based code spectra, MCE Spectral Acceleration values for rock, stiff soils, and soft soils are shown in Figure 2 for the two cities. Generally, the SA values are similar between the two codes except for soft soils where the EC-8 code is significantly more conservative than the IBC equivalent around structural periods shorter than 0.8 seconds.
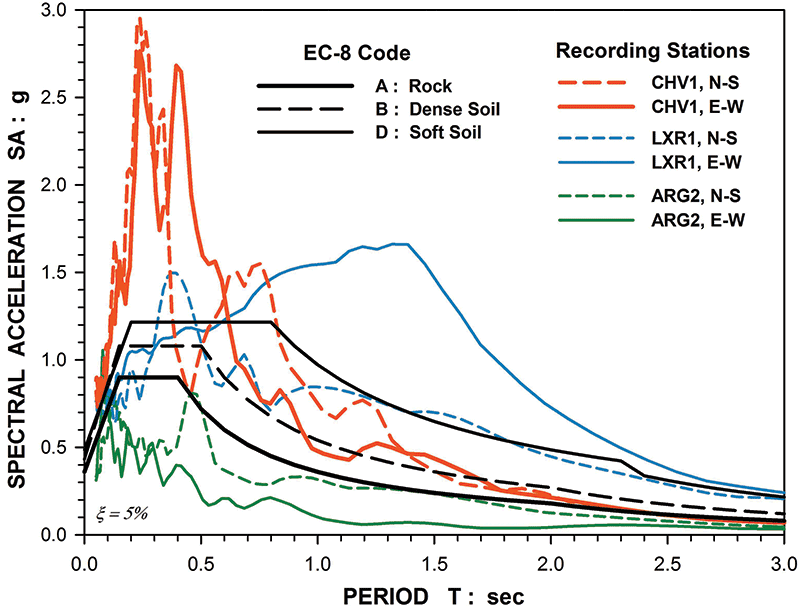
Figure 3. Comparison of elastic code (EC-8 and EAK) response spectra for various ground types with spectra of recorded motions from the 2nd event.
Ground Motion Recordings
The second event produced the highest ground motions, shown as acceleration response spectra compared to EC-8 code’s elastic spectra in Figure 3. The high ground motion amplitudes can be partially attributed to local site effects, directivity of shaking, and the pronounced irregular topography throughout the island.
Recorded SA values generally far exceeded code-based values, especially between periods ranging from 0.2 to 0.3 seconds, which correspond to the empirically expected period range of the majority of the building stock for two and three story RC buildings. These recorded SA values peaked at 3 g in the town of Chavriata and 1.5 g in the town of Lixouri, exceeding the maximum elastic code values by a factor of 1.25 to 2.5. Depending on the design Response Modification Factor (R), the recorded SAs could have resulted in actual seismic loads higher than the design values by an astounding factor of 2.5 to up to 8.5 (for R between 2 and 3.5).
Structural Observations
Overall, the building stock of Cephalonia is relatively new since most of the island was rebuilt after the 1953 events to meet the 1959 and later seismic codes. The close-knit family social structure of Cephalonia has created a tradition of building and expanding homes over the span of many decades. Several generations of a single family typically live together in the same house, which they expand vertically and laterally as their families grow. This results in buildings that have portions built decades apart under different codes and structural systems.
The predominant (residential and commercial) building type is well constructed, up to three stories in height, with a mix of reinforced concrete, masonry infill, and wood roofs. The infill masonry has concrete beams around openings, dowelled into the concrete structure. Hollow clay bricks in one or two vertical rows, with insulation material in between, are used for infill. A typical construction example and properties of a typical hollow brick are given in Figure 4.
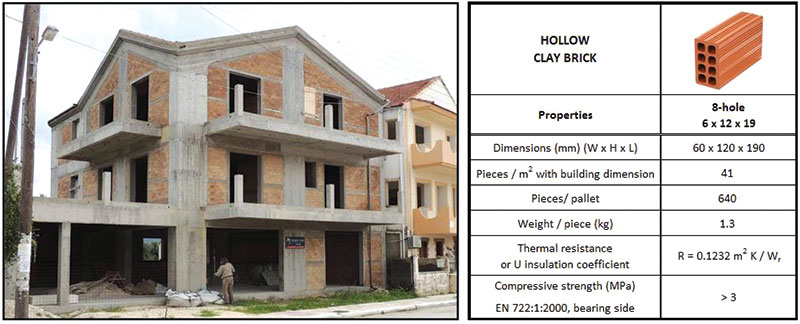
Figure 4. Typical confined masonry construction in Greece, with the infill masonry having concrete beams around openings, dowelled into the concrete structure (left). Characteristics of typical hollow clay bricks used for infill (right), after Xalkis Bricks (2015).
This practice is different from typical confined masonry (Meli, 2011) or regular infill masonry construction, as it is lighter due to the holes in the infill bricks and stiffer due to the thick RC structural frame. These low rise buildings behaved well during the 2014 earthquakes, at the most, suffering minor damage at the brick infill walls, which, in some cases, were separated from the RC frame. Most of the significant structural damage occurred in older masonry buildings that did not have this type of construction (GEER/EERI/ATC, 2014).
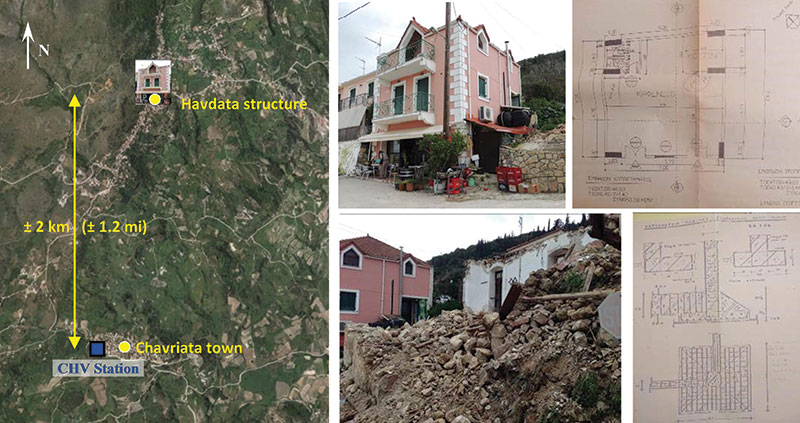
Figure 5. Havdata structure located 1.2 miles (2 km) north of CHV1 station sustained no significant structural damage while masonry building next to it collapsed completely. Copies of design drawings (right).
Case Study of Reinforced Concrete Havdata Building
A two (to three) story RC structure in the town of Havdata next to an old masonry structure that completely collapsed was selected as the case study. The building was built in 1995 in accordance with the EAK code. It is located about 1.2 miles (2 km) north of the strong motion station CHV1 in the town of Chavriata, which recorded very high accelerations (Figure 3). Shown in Figure 5, the ground floor of the structure is a coffee shop and the rest has residential occupancy. This structure was chosen because:
a) Its behavior was good despite its close proximity to CHV1. No major damage was identified other than some bottles falling off the shelves and some dislocated clay roof tiles, which is indicative of minimal or non-existent nonlinear behavior.
b) The reconnaissance information included design documentation and visual inspections. The owner provided us with design drawings and calculations that had been submitted to the local Department of Buildings, as it is a tradition for Greek owners to keep copies of these documents.
c) Acceleration time histories were available for analysis.
Modeling
The geometry of the Havdata structure, approximately 23 feet x 23 feet (7 m x 7 m) in plan, was approximated based on available drawings and photographs. However, the design documentation that was provided was found to be incomplete. Assumptions were made for the thickness of the concrete beams, and the strength and composition of the infill. The assumed member sizes, floor and roof dead loads and seismic weight, calculated per ASCE 7, are given in Table 1. The live load was taken as 40 psf (2 kPa) and 20 psf (1 kPa) for the floors and roof, respectively. The seismic weight includes dead load and perimeter wall loads. The perimeter walls were assumed to be a layer of thick hollow bricks with properties indicated in Tables 1 and 2. The bricks are 2.5 inches x 5 inches x 7.5 inches (60 mm x 120 mm x 190 mm) with a weight of 3 pounds (1.3 kg) for each brick. An effective thickness of 1.58 inches (40 mm) was assumed and the wall dead load over the façade area was taken equal to 20 psf (1 kPa).
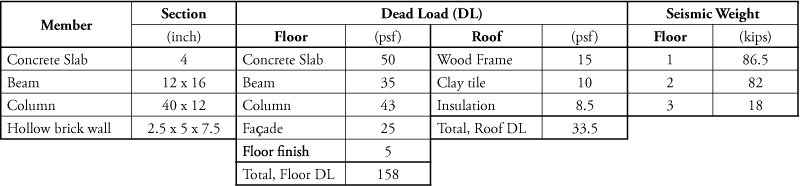
Table 1. Member sizes, loads, and seismic mass parameters used in modeling.
Based on the above information, a linear elastic finite element 3-D SAP2000 model was created, as shown in Figure 6a. For modeling, the beams were connected to the center of the columns and a rigid body diaphragm was assigned to nodes at each floor. The infill walls were modeled as shell elements.
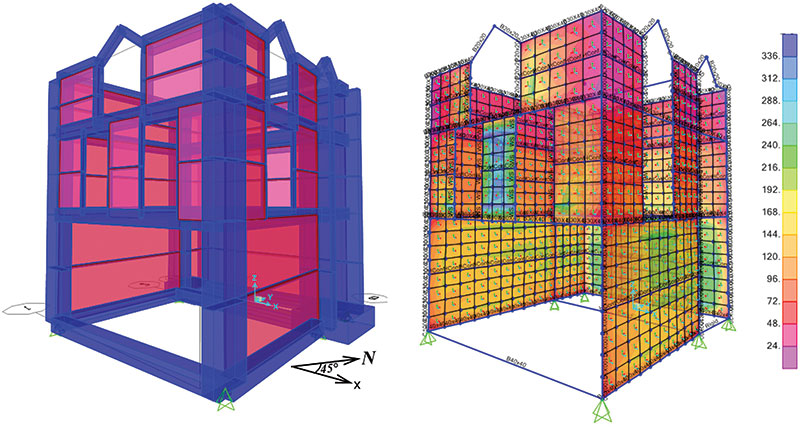
Figure 6. (a) Finite element linear elastic model of Havdata structure. (b) Distribution of maximum shear stress in infill walls (psi).
Input Ground Motions
The recorded ground motions from the CHV1 station during the second event were used for the dynamic time history analyses. These motions were recorded on reported stiff soil conditions and depict spectral accelerations that reach 2.4 to 2.7 g in both horizontal directions for short structural periods (less than 0.4 s). In addition to the soil-recorded motions and considering the overall geology around the Havdata house, bedrock ground motions were derived to examine the response to direct bedrock input. The derivation was made by filtering out the soil effects in the CHV1 records using a linear elastic deconvolution, which is an analytical procedure that produces a rock outcrop motion based on recorded ground surface motion. For the soil properties, the generalized sedimentary profile of interchangeable layers of weathered marls, limestone, and sandstone were used, presented in the 2014 GEER/EERI/ATC report for this area.
Specifically, the deconvolution analysis was performed for a 230-foot (70-meter) thick soil column having a linearly increasing shear wave velocity with a mean value of 1,500 ft/s (500 m/s). The resulting rock motions were found to be lower by an approximate factor of 2 in the short period range (0.2 and 0.4 seconds). Figure 7 summarizes deconvolution analysis and plots the predicted rock motions. Both rock and surface motions were rotated to the two orthogonal X-X and Y-Y directions of the building, for use as input in the structural model, assuming the X-X structural model axis has an angle of 45o with the North-South direction.
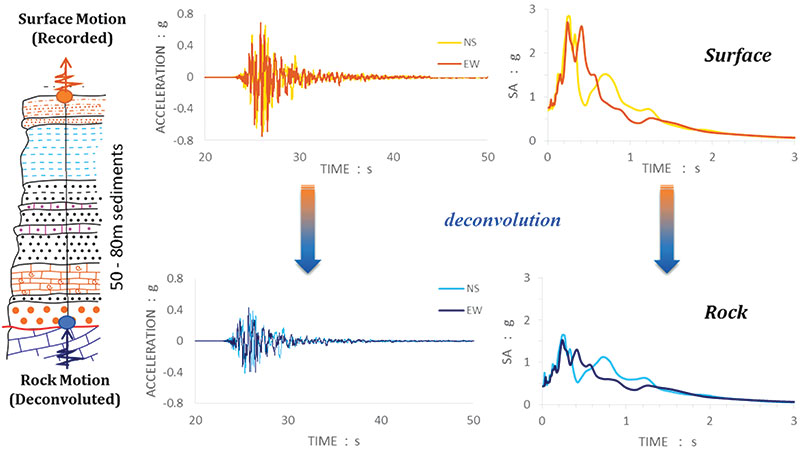
Figure 7. Ground motions at: (i) ground surface as recorded in the CHV1 station at the 2nd event (top) and (ii) rock at the Havdata building site (bottom), following deconvolution analysis of the generalized profile (left).
Dynamic Analyses
In an effort to simulate the observed behavior, the team performed five analyses varying the effective element thickness tw and the modulus of elasticity Ew of the infill walls. Specifically, the five sets of parameters used are:
1) tw = 1.58 inches (40 mm), Ew = 1,000 kips per square inch (ksi) (7,000 MPa)
2) tw = 1.58 inches (40 mm), Ew = 3,000 ksi (21,000 MPa)
3) tw = 3.15 inches (80 mm), Ew = 1,000 ksi (7,000 MPa)
4) tw = 3.15 inches (80 mm), Ew = 3,000 ksi (21, MPa)
5) No infill wall in the model
The results are summarized in Table 2, where Cases 1 to 5 were analyzed with the reduced rock motions and Cases 6 to 10 were analyzed with the recorded surface motions. The first (T1) and second (T2) structural modes of the building range from 0.08 to 0.14 seconds and 0.05 to 0.1 seconds, respectively. When the infill wall was removed from the model, the periods elongated accordingly to 0.31 and 0.26 seconds. The maxima of roof displacement, first story drift, and average shear stresses along the first story walls are also shown on Table 2, with plots of shear stresses in the model plotted on Figure 6b (page 29). Analyses considering thicker, heavier walls did not produce results significantly different than those in Table 2.
These preliminary results show that the building is stiff with short periods, and therefore, it shakes like a rigid body with small drift, which agree with the observations. While the results are reduced when the rock motions are applied instead of the soil motions, the stresses in the brick walls with clay units still exceeded the allowable levels, which are between 50 psi and 100 psi (International Masonry Institute, 1998) under both applied motions. Since no damage in the infill was observed, additional investigations on the infill material, the concrete construction, and a better understanding of the in-situ subsurface conditions and topography are needed to successfully replicate the observed behavior.
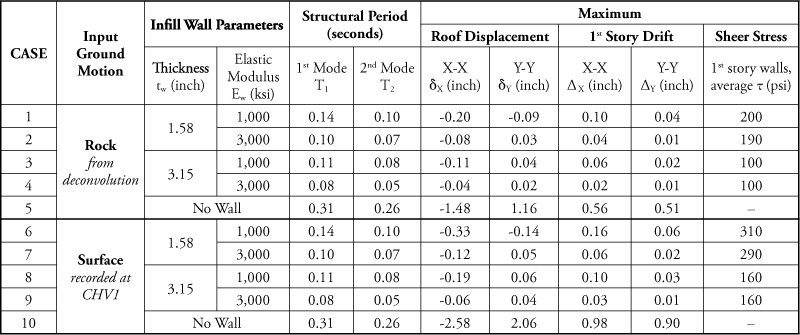
Table 2. Structural dynamic analyses. Varying parameters assumptions and summary of results.
Conclusions
– A sequence of strong earthquakes during January and February of 2014 in Cephalonia, Greece produced some of the highest ground motions ever recorded in Europe, reaching 2.5 g in the short period range between 0.2 and 0.3 seconds. Details are presented in GEER/EERI/ATC (2014).
– The typical modern local construction method is a modified confined lightweight masonry system with reinforced concrete moment frames, brick infill walls with hollow clay tiles, and roofs with wood frames. These short (two and three story) structures behaved essentially elastic with no serious visible structural damage and reacted more like rigid bodies with very short periods. The stiffening effect made the structures experience the peak ground acceleration, which was 70% smaller than the spectral accelerations in short periods.
– A case of a non-damaged structure in close proximity to a strong motion station was selected for analysis. Since no damage was observed, a linear dynamic time history analysis method was selected. Modeling was feasible since the team had visually inspected the structure, and obtained partial design and drawing documentation. To simulate local site conditions, the available recorded time histories were deconvoluted from the ground surface to the structure’s bedrock using a generalized soil profile.
– The analyses were varied parametrically to account for the uncertainty in the elastic modulus and the effective thickness of the infill wall. Results demonstrated very low periods of about 0.1 second and confirmed the observations that inferred small drifts and displacements during the events. The model predicted shear stresses in the infill material which would have caused damage that was not observed. Hence, this type of robust construction behaved better than expected.
– The Greek method of confined masonry is an inexpensive way for building RC structures with only 20% of the overall construction cost attributed to the structure. The observed and well documented good behavior of several structures of Cephalonia should be studied further, including pertinent testing of the infill material and its interaction with the RC frame, and in-situ testing to better define the site-specific ground motions. This method may be beneficial in other countries of high seismicity and similar weather. This design approach of shortening the structural period should ensure that the structure does not move in the inelastic range, which would elongate its period and attract significantly higher seismic forces.
In closing, the 2014 Cephalonia events allowed the reconnaissance team to focus on collecting data of resilient performance in addition to failures, paving the way to a new generation of reconnaissance that will hopefully lead to better understanding of resiliency after strong earthquakes.▪
The author’s gratefully acknowledge the support of GEER and NSF, EERI, and ATC for the reconnaissance mission to Cephalonia and the contribution of our Greek and U.S. collaborators that co-authored the GEER/EERI/ATC (2014) report.
Additional authors
Dimitrios Iliadelis, P.E. is a foundation engineer with MRCE. His expertise is on geostructural problems including support of excavation design in dense urban settings and advanced soil-structure interaction numerical modeling.
Menzer Pehlivan, Ph.D. is a geotechnical engineer with MRCE. Her expertise is on geotechnical earthquake engineering with specialization in site response analysis, soil property randomization, probabilistic seismic hazard and liquefaction analysis.
Akbar Mahvashmohammadi is a senior engineer with GMS where he works while completing his PhD on structural engineering in Lehigh University.
Sanaz Saadat, Ph.D. is a senior engineer with GMS. She joined the firm holding a PhD in civil engineering, specializing in structural and earthquake engineering, performance-based design, and seismic loss analysis.
Marina Moretti, Ph.D. is an Assistant Professor of Reinforced Concrete at the University of Thessaly (UTH), in Volos, Greece. She is a member of the American Concrete Institute (ACI) and International Federation for Structural Concrete (fib). Her research interests include modeling and seismic design of reinforced concrete elements and structures.
Anastasios Sextos, Ph.D. is an Associate Professor of Earthquake Engineering at Aristotle University of Thessaloniki, Greece. He is member of the American Society of Civil Engineers (ASCE) and Earthquake Engineering Research Institute (EERI), General Secretary of the Hellenic Association for Earthquake Engineering, and Board member of the Organization of Public Protection and Planning of Greece (OASP).
Panos Tsopelas, Ph.D. is an Associate Professor of Structural Dynamics at the National Technical University of Athens, Greece (formerly Professor of Structural Dynamics and Earthquake Engineering at UTH). He is a member of ASCE and EERI and his research interests include structural dynamics and seismic protective systems.
REFERENCES
ASCE (2005). ASCE/SEI-7-05 Minimum Design Loads for Buildings and Other Structures, American Society of Civil Engineers, Reston, VA.
EAK (2000). Greek Seismic Code, Ελληνικός Αντισεισµικός Κανονισµός, Athens, Greece, (in Greek), with an amendment in 2003.
EC-8 (2008). Eurocode 8: Design of structures for earthquake resistance, European Committee for Standardization, Doc CEN/TC250/SC8/N317, CEN.
EERI (2014). “M6.0 South Napa Earthquake of August 24, 2014,” Earthquake Engineering Research Institute Special Report (available at www.eqclearinghouse.org/2014-08-24-south-napa/files/2014/08/EERI-Special-Eq-Report-2014-South-Napa-versionOct19web.pdf).
EPPO-ITSAK (2014). The earthquake of 26/1/2014(M6.1) in Cephalonia (Greece): Strong Ground Motion, Soil Behaviour and Response of Structures, Preliminary Report, itsak.gr/news/news/70, last accessed 3/24/14.
GEER/EERI/ATC (2014). Earthquake Reconnaissance January 26th /February 2nd 2014 Cephalonia, Greece Events, by Geo-Engineering Extreme Events Reconnaissance Association, Earthquake Engineering Research Institute, and Applied Technology Council (available at www.geerassociation.org/GEER_Post%20EQ%20Reports/Cephalonia_Greece_2014/.) Nikolaou, S., Zekkos, D., Assimaki, D., and Gilsanz, R., eds., with contributing authors.
International Masonry Institute (1998). The Planning and Design of Load Bearing Masonry Buildings.
Masonry Standards Joint Committee (2008). Building Code Requirements for Masonry Structures, TMS 402/ACI 530/ASCE 5.
Meli, R. et al. (2011). “Seismic Design Guide for Low-Rise Confined Masonry Buildings,” Confined Masonry Network: World Housing Encyclopedia, EERI & IAEE with funding support from Risk Management Solutions www.world-housing.net/wp-content/uploads/2011/08/ConfinedMasonryDesignGuide82011.pdf
NCEER (1994). “The Northridge, California Earthquake of January 17, 1994: General Reconnaissance Report,” National Center for Earthquake Engineering Research Report No. NCEER-94-0005, 222 pp., J. Goltz, ed. (available at: mceer.buffalo.edu/pdf/report/94-0005.pdf)
NOA-IG (2014). Preliminary analysis of recordings from the NOA-IG accelerographs from the 1/26/14 Cephalonia earthquake, National Observatory of Athens, Institute of Geodynamics, prepared by I. Kalogeras (in Greek), gein.noa.gr/Documents/pdf/Cefalonia_20140126_preliminary_web.pdf, last accessed 3/24/14.
Papaioannou Ch., et al. (2006). “Introduction on the Seismological Data and their Elaboration for the Compilation of the new Seismic Hazard Zoning map of Greece,” 5th Hellenic Conf. Geotechnical & Geoenvironmental Engineering, Xanthi, Greece.
Papazachos, B. and Papazachou, K. (2003). The earthquakes of Greece, Zitis Publ., Thessaloniki, 356 pp., 304 pp., 286 pp. (in Greek).
Xalkis Bricks (2015). Greek Brick Properties Table xalkis-sa.com/index.php/products/touvla/, last accessed 1/15/15.