
Starting in 2008, members of the project team, along with others, performed tests to show that the American Concrete Institute (ACI) 318-11 Appendix D concrete shear capacities for steel anchor bolts with small edge distances connected to wood sill plates were extremely low compared to actual tested values. As a result of the tests, a code change was made to the International Building Code (IBC) 2009 to allow the use of much higher shear values for anchor bolts connected to wood sill plates. That project comprised a two-year effort driven by practicing engineers in association with an industry partner.
The current project is again aimed at providing practical test results to design professionals and building code officials, but this time for the frequently specified (but not necessarily accepted) anchorage details in tension-only anchor rod systems. With the support of our industry partner (Simpson Strong-Tie® Company, Inc.), this project is moving closer to converting valuable test data into a useful design methodology and possible regulation modification. The current project is divided into two phases as follows:
Phase 1 (completed in June 2012) proposed a testing protocol for the extensive Phase 2 testing. To validate and/or refine the proposed testing protocol, Phase 1 concluded with the construction and testing of three full-scale experimental specimens featuring both center-of-slab and edge-of-slab details. Phase 1 experiments were performed at Scientific Construction Laboratories, Inc. (SCL) in Lafayette, California (Figure 1).
Phase 2 is currently in progress at Simpson Strong-Tie’s Tyrell Gilb Research Laboratory in Stockton, California (Figure 1). Phase 2 features full-scale podium slab sections with varying levels of special detailing for both center-of-slab and edge-of-slab conditions. Interim results suggest that test data correlates well with calculated uncracked average ultimate capacities of anchors (without anchor reinforcing) using ACI 318-11 Appendix D with all design reductions removed.
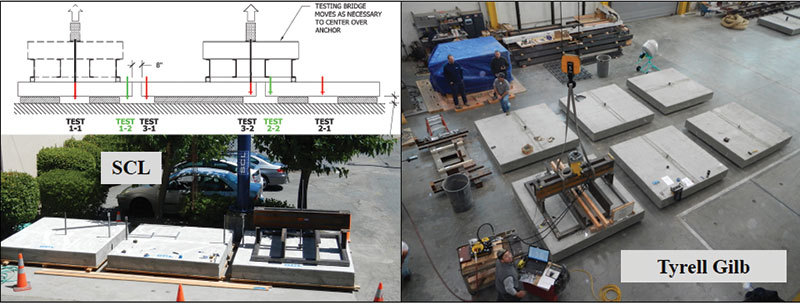
Figure 1: Test layouts at SCL and Tyrell Gilb laboratories.
Testing Protocol Development
The research team selected the use of a monotonic loading protocol in an effort to understand controlling behaviors and failure mechanisms, and to establish data that is comparable to a majority of test data already available. Results of a literature search indicated that adding plates at the bottom of the embedded tension-only anchor rods would increase the size of the concrete failure cone, and hence the load capacity. The research team did not find any literature on reinforced concrete sections.
Phase 1 experiments at SCL validated the testing protocol using a high-capacity testing bridge previously developed by Simpson Strong-Tie. Figure 1 depicts each 8-foot x 8-foot x 1-foot concrete specimen with anchors cast in the field and at the edge. The slabs were elevated off the ground to avoid any potential restraining effect on slab bending. Slabs were reinforced to prevent bending failure per ACI 318-11, section D.3.3.2. To ensure that a bending failure would not occur, the amount of steel specified for the test was 75 percent more than the amount required by analysis. The slab was analyzed using RISA-3D as a compilation of plate elements, with the testing bridge as an assembly of beam elements.
Figure 2 and Table 1 show a summary of the Phase 1 experiments. A published testing report describes further details related to the setup and results. Table 1 compares some model building design demands with currently available design capacities. The limited design capacity for concrete anchorage is immediately apparent once building height exceeds three stories.
Table 1: Initial Phase 1 testing results and typical seismic design demand.
In all respects, Phase 1 experiments verified basic assumptions valuable to the development of the Phase 2 test program. Adequate reinforcing steel prevented bending failures in the slabs. The tension breakout cone failures for the center (away from edge) tests occurred as anticipated; however, the capacity was higher than expected. It appears that the flexural steel crossing through the cone added to its capacity. The tension breakout failure at the edge occurred at a load substantially higher than the ACI 318-11 Appendix D prediction. This was likely due to the unintentional benefit of vertically oriented hooks at the ends of the top and bottom flexural bars that crossed the cone failure plane in several locations. To understand the connection behavior more thoroughly, future tests (Phase 2) would include additional steel specifically to reinforce the cone (anchor reinforcing) located near the anchor and crossing the anticipated failure planes, as well as control tests without any anchor reinforcing.
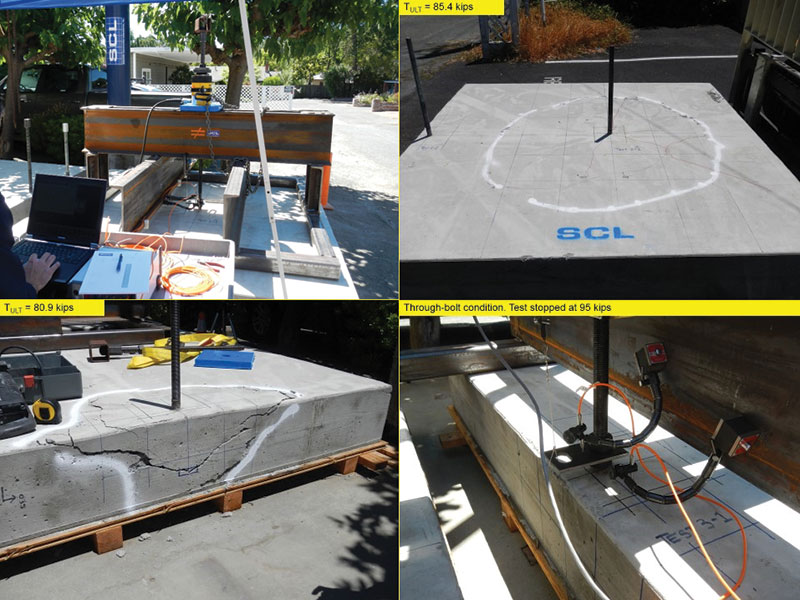
Figure 2: Phase 1 edge and field testing.
Lessons Learned
Large, high-strength anchor rods, nuts, washers and couplers are all potentially special-order items (not available at local construction supply centers), with significant lead times exceeding four days. To avoid substitution requests, consider providing enhanced submittal requirements in specifications for anchorage in design.
Engineers are constantly receiving feedback and/or criticism from contractors regarding constructability. The Phase 1 experiments were no exception. The “as-planned” geometry for the anchor rods was difficult to achieve, particularly at edge conditions. Appropriately scaled sketches are necessary to verify the constructability of the anchorage connection.
Non-destructive testing (NDT) techniques were employed as part of the Phase 1 effort. This testing was used to confirm as-built clearances and/or geometry. NDT was limited to pachometers and ground-penetrating radar (GPR) methods (Figure 3).
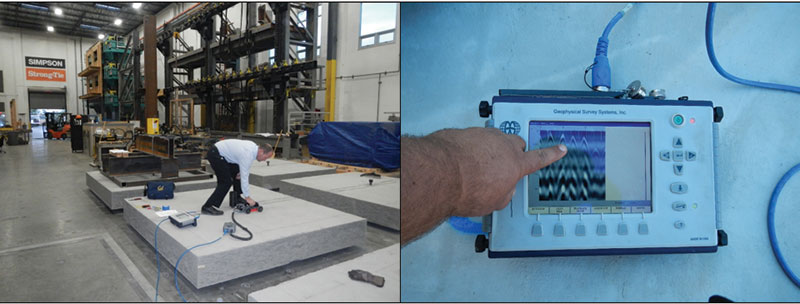
Figure 3: Non-destructive testing (NDT).
Based on NDT results, the research team confirmed that Structural Observation and/or Special Inspection prior to concrete placement will provide good conformance with designed anchorage detailing. To ensure consistent construction quality, engineers might consider requiring and/or incorporating photo-documentation of installed anchorage and reinforcing around the anchor. While unique, this level of inspection and confirmation is important given the critical nature of most anchorages of this type.
Phase 2 Testing
The Phase 2 testing at Tyrell Gilb Research Laboratory involved 12 test specimens to research anchorage away from edges (i.e., field). These tests were designed to examine different conditions associated with various flexural reinforcement ratios, as well as the effect of localized anchor reinforcement. Future testing will be performed with anchors located at the edge of slabs to determine the effects of anchorage reinforcement at the slab edges.
All specimens had a concrete compressive strength of 5,000 psi and reinforcing steel per ASTM A615, Grade 60. The 8-foot x 8-foot x 1-foot slabs were tested while supported off the ground by use of a grid of 4×4 timber members aligned with the test frame located at the top of the slab above. A hollow-core hydraulic ram applied displacement-controlled loads to the anchor. A representative from Testing Engineers Inc. independently observed and documented all Phase 2 experiments.
The initial Phase 2 experiments were run in pairs to test three main configurations: (1) anchors without additional anchor reinforcement; (2) anchors with one-piece inclined anchor reinforcement (Figure 4); and (3) anchors with two-piece inclined anchor reinforcement (Figure 5). For each of these configurations, two slab flexural reinforcement conditions were varied. In the first case, flexural reinforcement was insufficient to prevent plastic hinging (Inadequate). In the second case, flexural reinforcement was sufficient to prevent plastic hinging (Adequate).
Figure 4: Cross-section of slab showing one-piece anchor reinforcement.
Figure 5: Cross-section of slab showing two-piece anchor reinforcement.
As shown in Table 2 and Figure 6, Phase 2 results indicate that under-reinforced concrete slabs will typically fail in flexure before a shear cone can develop. These results prove the adequacy of ACI 318-11 Appendix D considering a limitation on anchor capacity for locations where a plastic hinge can form as noted in D.3.3.2.
Table 2: Initial Phase 2 testing.
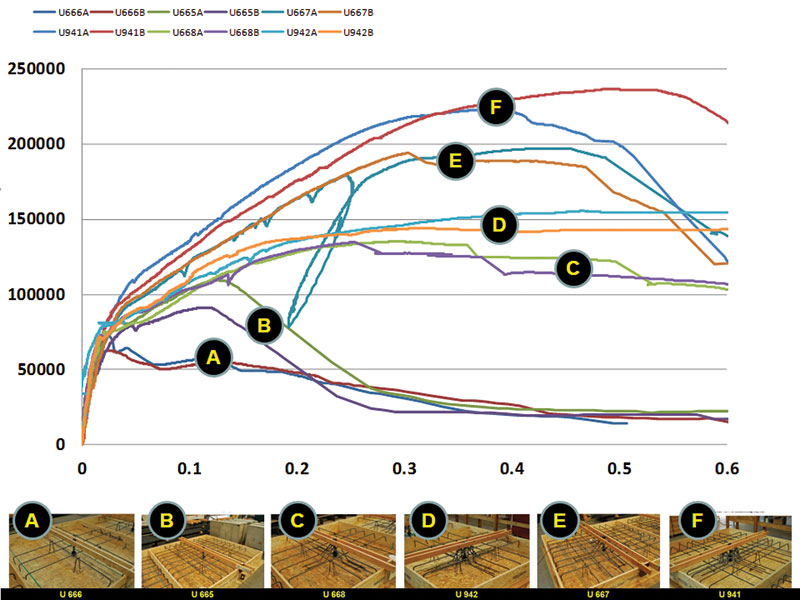
Figure 6: Initial Phase 2 test results. Pre-test photos courtesy of Testing Engineers, Inc. (TEI).
Figure 7 shows failure surfaces and corresponding peak loads (average of two tests) for two different anchor reinforcement conditions. Test B has no supplemental anchor reinforcement; Test E has a one-piece inclined bar anchor reinforcement.
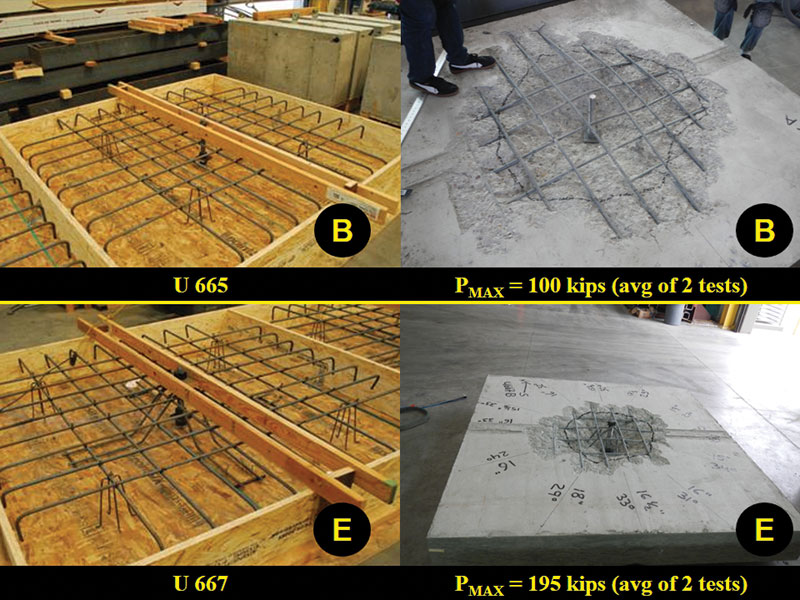
Figure 7: Test “B” and Test “E”. Pre-test photos courtesy of TEI.
Figure 8 also shows the failure cone and corresponding peak loads (average of two tests) for reinforced and unreinforced anchor specimens. Test B has no supplemental anchor reinforcement; Test F has two-piece anchor reinforcement. With sufficient flexural reinforcement, a shear cone will develop as indicated in ACI 318-11 Appendix D. By adding anchorage reinforcement (bars dedicated to resist shear cone failure), the capacity of the anchor in tension can be significantly increased.
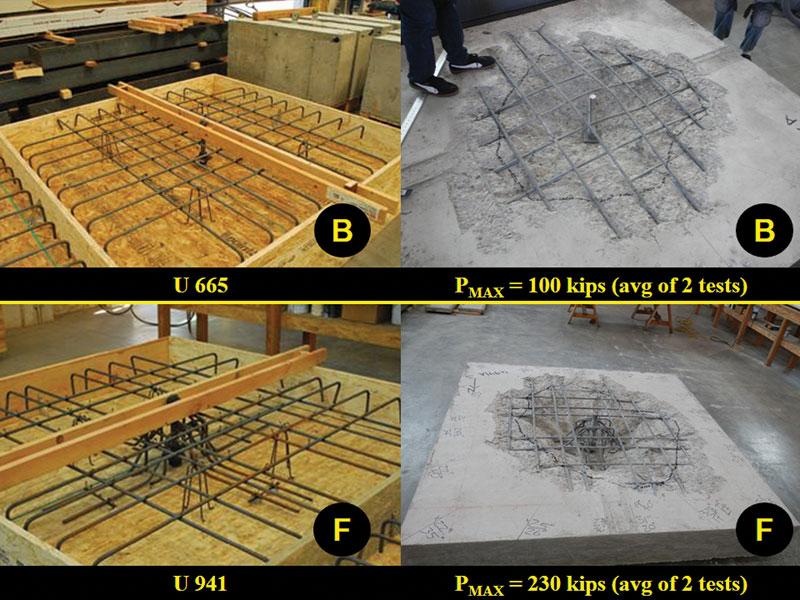
Figure 8: Test “B” and Test “F”. Pre-test photos courtesy of TEI.
ACI 318-11 section D.5.2.9 permits the strength of properly developed anchor reinforcing to be used in lieu of the tension cone breakout strength in determining design resistance. It is clear from the results of Tests “B” and “D” that neglecting the strength of the concrete breakout would be a highly conservative assumption for the tested condition. Test D was identical to Test B except for the addition of single-piece anchor reinforcing (Figure 4) that crossed the theoretical plane of the tension cone at a 45° angle. Cone failures controlled both test series, with the Test D cone projecting through the sloping sides of the anchor reinforcing.
It is interesting that, in these sloping sides, the vertical component of the nominal yield strength was 105 kips. Figure 7 shows that the ultimate capacity of Test D is nearly the sum of this 105 kips and the Test B results. Predicting the average uncracked ultimate tension cone breakout force of Test B using ACI 318-11 equation (D-6) with kc=40 (instead of 24; this removes reductions for cracks and reduction from average result to 5% fractile), and also properly considering the ANC/ANCO ratio in accordance with D.5.2.1 and D.5.2.8, yields a predicted strength of 83 kips. Combined with the 105 kips from the anchor reinforcing results in a predicted sum of 188 kips, which is also very close to the 195-kip average test result.
As mentioned previously, it is thought that the horizontal flexural reinforcing that passes through the breakout cone increases cone capacity, but the effect remains undetermined. When attempting to correlate test data and calculations for tension cone breakout strength, it was necessary not only to adjust the calculation to reflect the average instead of a 5 percent fractile result, but also to disregard the crack reduction factor even though bi-directional cracks through the cone were clearly evident during the testing and prior to cone failure, which should result in a larger crack reduction than just one-directional cracking. The inability of cracked concrete to transfer tensile stress across the crack in the cone area changes the internal force distribution in the cone, resulting in a smaller breakout force; yet it is also known that the amount of reinforcing in cracked concrete testing can significantly influence the result. More research is needed to understand how the crack reduction factor should be applied in concrete with significant flexural reinforcing passing through the cone.
Developing anchor reinforcement on each side of the failure plane can further increase tension capacity. Different arrangements of shear reinforcement can shift the failure plane of the shear cone farther away from the anchor, increasing the area of the cone and the tension capacity of the anchor. Interim results suggest that some change to existing regulations may be warranted when considering this specific condition (anchor reinforcing in “thin” reinforced elements). Other groups (e.g. NEHRP Provisions Update Committee, Issue Team 3, and Simpson Strong-Tie) are further exploring this effort analytically and experimentally.▪
Acknowledgments
The Structural Engineers Association of Northern California (SEAONC) provided a $10,000 grant through their 2012 Special Projects Initiative. In the Phase 1 experiments, the Simpson Strong-Tie Company (SSTC) generously loaned their loading bridge and helped guide the protocol development. In the Phase 2 testing, Simpson Strong-Tie did virtually everything, from procuring the materials and constructing the specimens to leading the complex analysis of the data. This article is adapted from the Proceedings of the 10th U.S. National Conference on Earthquake Engineering, which will take place July 21-25, 2014 in Anchorage, Alaska, hosted by the Earthquake Engineering Research Institute (EERI).
This article is derived from an Interim Report on Testing of Tension-Only Steel Anchor Rods Embedded in Reinforced Concrete Slabs, SEAOC Convention Proceedings, September 2013, San Diego, CA.