
Advances in computational tools for earthquake engineering analysis continue to broaden the structural engineer’s ability to conduct performance-based simulations, evaluate ductility, and make decisions on performance criteria that involve deformations of a structure beyond the elastic limit. However, with the advent of these tools, the industry has also seen a proliferation of software packages with input options and parameters, which must be understood to perform acceptable and meaningful nonlinear analyses. In 2012, a 17-question survey was conducted to ascertain existing perceptions relating to the application of nonlinear analysis methods in earthquake engineering, how nonlinear analysis is being applied, which tools/guidelines are being used to support nonlinear analysis, and what are the overall barriers to entry for conducting nonlinear analysis. The survey was designed to correlate the responses to the various groups of end-users so that trends in user behavior could be identified. A secondary motivation for the survey, and a primary motivation for this article, is to stimulate discussion and solicit further feedback from the earthquake engineering community regarding the use of nonlinear analysis in practice. Interested readers are invited to share their experiences and viewpoints by responding to the survey link mentioned below.
Survey Demographics
The 76 survey respondents classified themselves in one of four categories: 1) Academician/Research Engineer, 2) Industry Professional, 3) Consultant and 4) Other. The responses for each group were analyzed separately with a tally for each question, allowing trends and patterns to be exposed among the different categories. Understanding that there might be some regional bias to the responses, there was actually a strong representation of respondents from each of the four major U.S. time-zones: 33% stationed in EST, 16% in CST, 12% in MST, and 35% from PST. A majority of the respondents (approximately 86%) also reported having a Master of Science/Master of Engineering degree or higher, and 78% stated that they had obtained their Professional Engineer (PE) licensure.
Respondents that listed themselves as Academicians/Research Engineers reported the highest number of individuals, 25/27 (~93%), who held a master’s degree or higher. Of the Industry Professionals, 20/23 (~87%) reported having degrees beyond the baccalaureate with at least master’s degree. Of those who identified themselves as Consultants, 14/21 (67%) have at least a master’s degree, 3 have PhDs and 2 have MBAs.
Familiarity with Nonlinearity Analysis Types
For the Academicians/Research Engineers, it wasn’t a surprise when the results concluded that most of the respondents with higher level degrees were familiar with and use nonlinear analysis methods. Academicians/Research Engineers reported capturing both geometric and material nonlinearities; however, all were familiar with or had applied material nonlinearity. All except two (~7%) of the Academicians/ Research Engineers responded as having applied, or having familiarity with, geometric nonlinearity. More than 50% of the Academicians/Research Engineers had applied or were familiar with contact nonlinearity. 81% of the Consultants reported having expertise in material nonlinearities, 57% stated having expertise with geometric nonlinearities, but only 19% stated having expertise with contact nonlinearities. Of the Industry Professionals, 90% reported having familiarity with geometric nonlinearities, 86% with material nonlinearities, and 38% with contact nonlinearities.
Types of Structures Analyzed
Respondents had to indicate what type of structures upon which they actually performed nonlinear analyses (multiple selections could be made). The majority of the respondents focused on buildings, followed by bridges and then non-building structures. In fact, 48% of the Academicians/Research Engineers analyzed both bridges and buildings but only 14% of Consultants and 13% of Industry Professionals focused on both.
Areas of Expertise
The next set of questions focused on the specific area of seismic expertise/experience for which the nonlinear analyses was being conducted. All of the respondents indicated that they specialize in seismic design and seismic retrofit. There was an equal distribution of Industry Professionals and Academicians/Research Engineers who specialized in performance-based design. Of all the respondents, the Consultants reported having the least amount of experience in seismic isolation and earthquake engineering research. However, all Consultants who participated in the survey responded as having expertise in seismic design, and more than half also responded as having expertise in seismic retrofit and performance based design. Three of these respondents also stated that they had expertise in seismic isolation and earthquake engineering research.
Use and Clarity of Nonlinear Analysis Resources
Participants were asked to identify “Which resources do you currently use or have used in the past?” In all categories of respondents, more than 75% referred to ASCE and FEMA/NEHRP documents as resources used or used in the past to conduct nonlinear analysis. Other resources to choose from were ATC, Tech Briefs, AASHTO/State DOT, and Other. As a follow-up question to this, respondents were prompted to rate whether or not available guidelines for the following topics were “clear and easy to apply” or “ambiguous and needs improvement”:
- Structural modeling of nonlinear elements (e.g., fiber, elements, material modeling, etc.)
- Pushover analysis
- Selection/scaling of ground motions
- Application of damping to a structure
- Site specific seismic hazard analysis
- Nonlinear time history analysis
- Inclusion/modeling of soil-structure interaction
- Risk analysis (e.g., fragility curves, damage assessment, etc.)
The majority (more than 75%) of all respondents said that the guidance for most of these topics was ambiguous, where the patterns plotted by respondents (Academicians/Research Engineers, Industry Professionals, Consultants, and Other), are also noted in Figures 1 through 4, respectively. While the distribution is important to note, it is overwhelmingly apparent that there are more respondents that consider the guidance for performing these analyses to be ambiguous! Do you agree?! These results indicate that more direction and guidance for these topics would be useful.
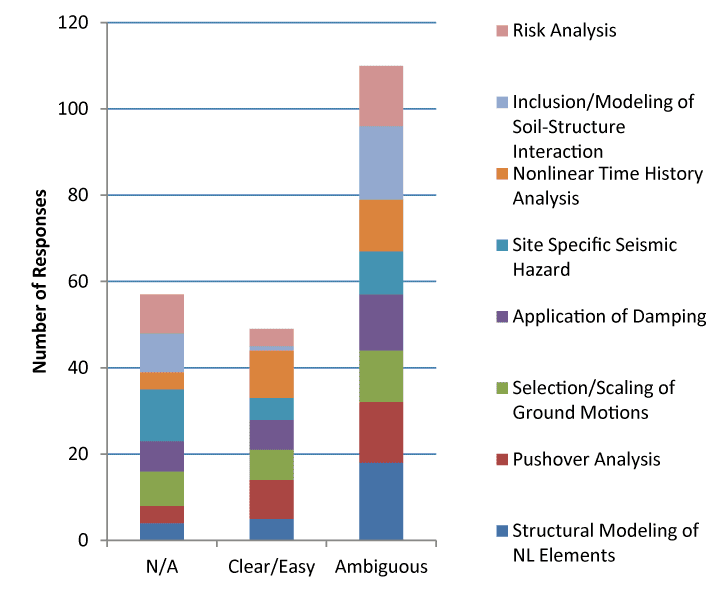
Figure 1: “Academicians/Research Engineers” responses regarding guidelines to support various applications.
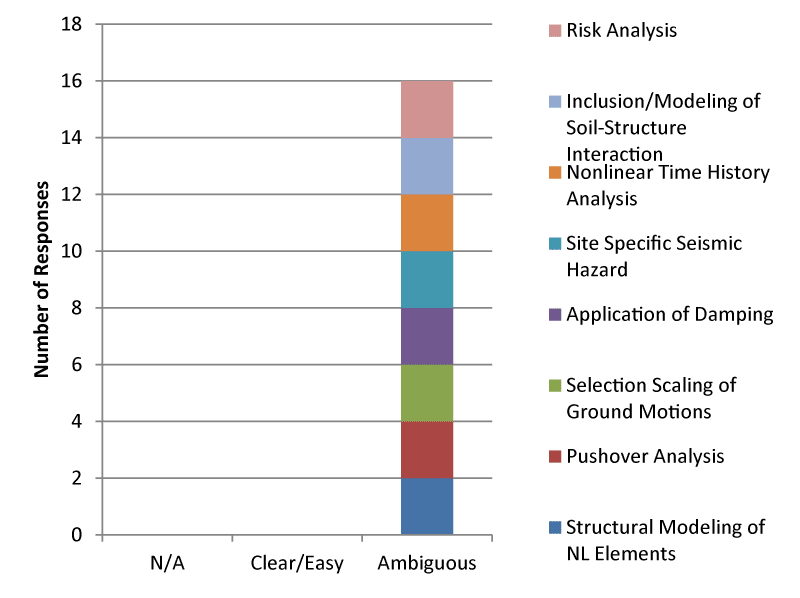
Figure 4:”Other” Professionals’ responses regarding guidelines to support various applications (Note: there were only 2 respondents in this category).
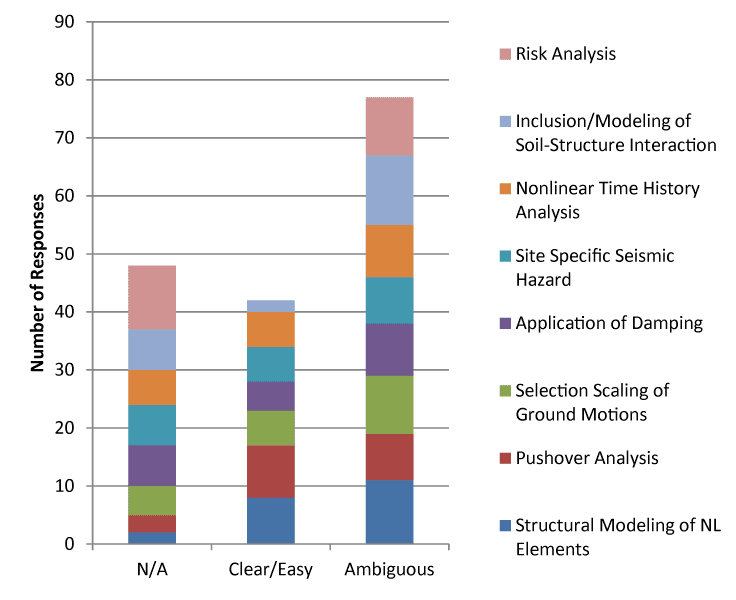
Figure 3: “Consultant” responses regarding guidelines to support various applications.
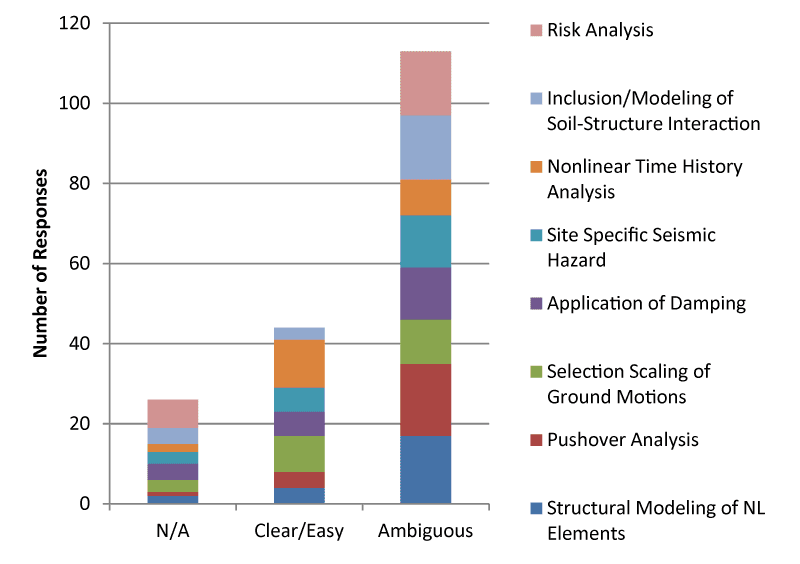
Figure 2: “Industry Professionals” responses regarding guidelines to support various applications.
Software Used for Nonlinear Analysis
Trends in the specific software packages/programs used to carry out any nonlinear analysis were solicited next. Given the wide range of nonlinear analysis packages available, respondents were asked to select from various academic and commercial software packages. The options included ANSYS, PERFORM-3D, SAP/ETABS, STAADPro, OpenSEES, other programs like State DOT Bridge Software, Oasys/LS DYNA, GTStrudl, NASTRAN, and in-house software. Zero participants selected ADAPT and NASTRAN. NASTRAN, written in FORTRAN, can be used for analyzing linear elastic static and dynamic case studies, and is targeted more for the aerospace and mechanical fields). The breakdown per respondent category was as follows, and is also shown in Figure 5:
- Academicians/Research Engineers used OpenSEES more frequently followed by SAP/ETABS and PERFORM-3D. OpenSees (Open System for Earthquake Engineering Simulation) is a software framework used to simulate structural and geotechnical systems for earthquake analysis. The software can be used for parallel computing of scalable simulations.
- Industry Professionals responded that they primarily used SAP/ETABS, followed by PERFORM-3D and STAADPro which are 3-D structural analysis programs commonly used by structural engineers, especially for nonlinear analysis and performance assessment.
- Consultants did not provide as many responses compared to the other respondents but it was concluded that SAP/ETABS was the most popular.
- In the Other category, both participants responded as having experience using SAP/ETABS with one also using PERFORM-3D.
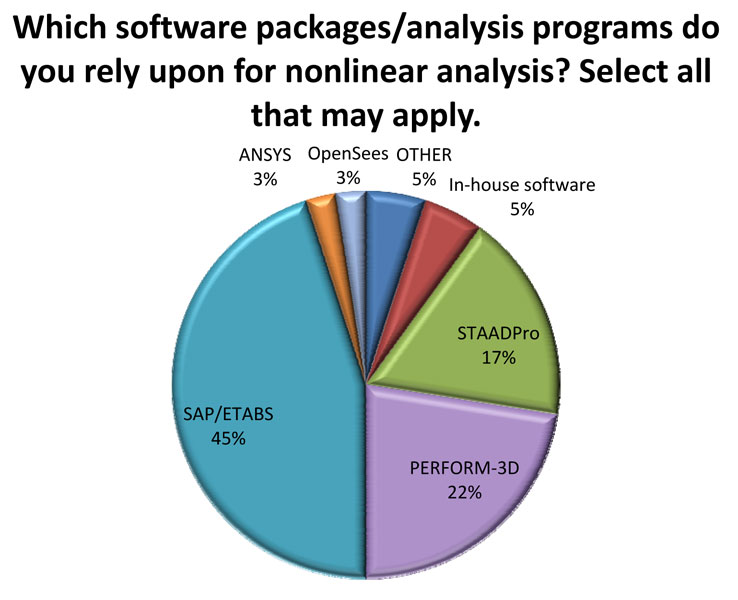
Figure 5: Responses to software packages/analysis programs used for nonlinear analysis.
Barriers for Implementing Nonlinear Analysis
Identification of any real or perceived barriers to applying/using nonlinear analysis was queried. The respondents were asked to provide their personal opinion, where multiple answers could have been selected. Of all the respondents, “Not Practical/Time-Consuming (61%),” “Lack of Adequate Guidelines (43%),” “Too Complicated (29%),” “Lack of Research (22%),” and “Inadequate Software Capabilities (21%)” were all reasons for barriers to entry. A breakdown of the responses is shown in Figure 6.
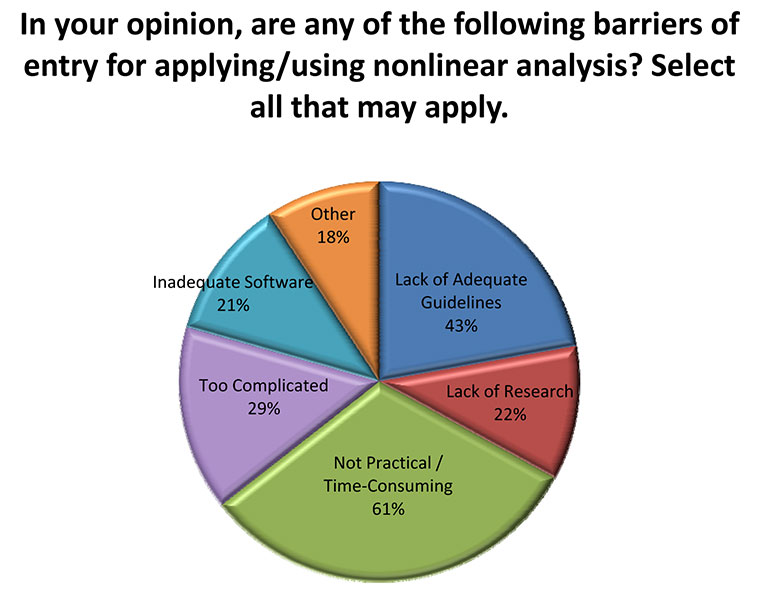
Figure 6: Breakdown of responses to barriers for implementing nonlinear analysis.
Desired Additional Guidance
Key to furthering the use of nonlinear analysis tools is to identify the #1 topic (one selection only allowed) for which having additional guidance would be most helpful. Academicians/Research Engineers responded that the #1 need was for there to be benchmark problems with solutions followed by modeling nonlinear elements/understanding parameters. Consultants and Industry Professionals both responded that the #1 need was for guidance on modeling nonlinear elements/understanding parameters. Overall, as shown in Figure 7, modeling nonlinear elements/understanding parameters was the #1 topic followed by the need for benchmark problems with solutions. The other options for selection were the need for software-specific input files and guidance, selection of ground motion input or load parameters, and NLA procedures (NLTH, etc.).
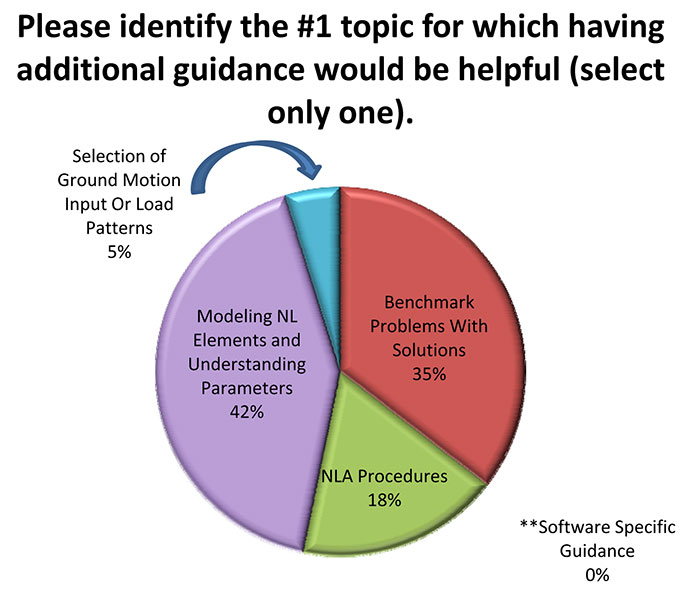
Figure 7: Responses to a “desire for additional guidance” question.
Additional Comments
The survey also had a “free field” comment box that also brought to light some important concerns, where respondents were asked to report any barriers to entry into nonlinear analysis techniques and tools. Simply stated, many reported that a barrier to entry is the high complexity and time required for inputting the information and interpreting the data, which is not always straightforward. Moreover, many noted that there is a need to be able to communicate the importance of doing a nonlinear analysis to the owners, as the apparent gain to pay for a more extensive analysis is not always clear. It is known that advanced nonlinear analysis can be used to assess the need for a retrofit process, structural upgrade, or simply a need to verify adequate capacity given certain demand loads on a structure. But when is it appropriate to even conduct or justify the cost of conducting a nonlinear versus linear analysis? As such, barriers to entry are not just limited to the need for more guidance and examples, but for communicating the benefit of such an analysis (where appropriate) to the owners. All of these highlights were important to note and can be game-changers when entering (or not!) the field of nonlinear analysis.
Take the opportunity to chime in on the discussion. Please visit the link and complete the survey. Be sure to leave your opinion as to the next big effort that should be made to improve this aspect of Earthquake Engineering.
Conclusions and Recommendations
The use and applicability of nonlinear analysis tools and design guidelines to solve various problems facing the earthquake engineering community are not always straightforward and by no means fully transparent. Despite the advancing capabilities of powerful software packages, there is quite a level of detail and background knowledge needed in order to develop refined models and perform various analyses, where the amount of input information required can be daunting given the multitude of input options that may not always be known at the time of analysis. While there is a gap between the end-users, design guidelines, and software packages, it is known that many benefits can be gained when a nonlinear analysis is conducted for an appropriate case. However, when to apply nonlinear analysis is not always straightforward or transparent, especially when various nonlinearities need to be captured. With the advent of faster processors, implementing nonlinear techniques in design practice will be more feasible in the coming decade provided adequate guidelines exist. While not alarming, the results from this survey helped to:
- reveal to users within the earthquake engineering community who (Academicians/Research Engineers, Industry Professionals, Consultants, and Other) is using what type of software, for what application of nonlinear analysis, and the various tools/guidelines being used to support the analysis;
- identify some barriers for entry into nonlinear analysis such as the high complexity, time consumption, lack of clear guidance, and communicating the benefit of advanced analyses to the owners; and
- provide users within the earthquake engineering community, especially the ASCE Subcommittee on Emerging Analysis Methods in Earthquake Engineering, with evidence to possibly develop more guidance materials that offer benchmark problems with solutions followed by modeling nonlinear elements/understanding parameters when conducting nonlinear analysis.
To assist with bridging the gap of seemingly inadequate guidance for conducting nonlinear analysis, users are recommended to reference available resources, such as tech briefs published by NEHRP, which appear to currently be underutilized and could assist in reducing the overall ambiguity that is perceived around this topic. Nonlinear analysis can be used when owners request ways to reduce costs (for new construction) by optimizing material use, more likely though as a way of demonstrating a building retrofit is perhaps not even necessary (or if it is, that only minor changes/systems are needed rather than what the code would require), or even as a way of quantifying performance for owners, insurance and risk managers that may look at inventories of structures. There is, however, a cost associated with performing this analysis. So the major question to the owner is whether they’d prefer to “pay now or pay later?”
Acknowledgment
The findings and opinions presented herein are those of the authors and are not necessarily those of the American Society of Civil Engineers (ASCE) Subcommittee on Emerging Analysis Methods in Earthquake Engineering. The support provided by the Subcommittee is greatly appreciated. The Subcommittee cordially invites all those interested in learning more about its activity and future pursuits to attend Subcommittee meetings during the 2014 ASCE Structures Congress in Boston, MA.▪